Circles, Lines and Regions

Last week when I was trying to sort out a combinatorial question related to my research, I accidentally ended up redoing some fun geometry of the type covered (?) in an undergraduate discrete math, or intro to topology course.

I’m going to ramble on a bit about some fun pictorial counting games, with no particular point in mind, except to show some pretty relations.

The first has to do with geometrical arrangements on a sphere.  It’s not hard to see (unless you are Camille Jordan) that if you draw a circle on a sphere it separates the surface into two regions.
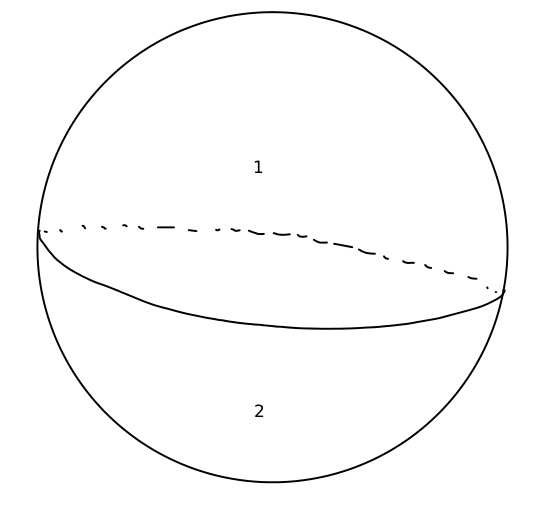
A sphere divided by a great circle

A sphere divided


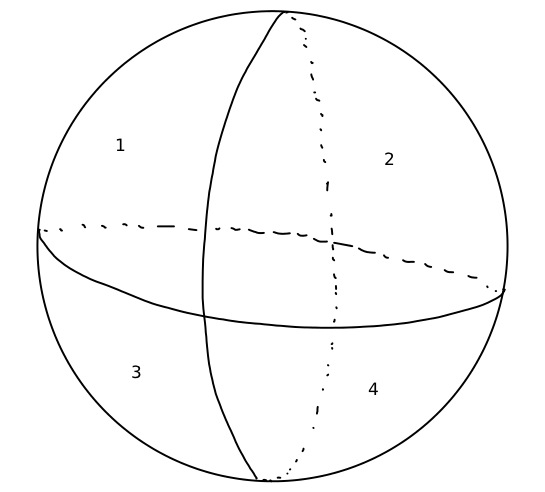
The circle on the sphere in the figure is a special kind of curve called a great circle, which divides the sphere into to equal halves.  A great thing about great circles is that any two of them intersect in exactly two points.  You can easily see this if we add another line to the picture.
two great circles on a sphere

Two great circles on a sphere make 4 regions


Notice that now the sphere has been split into four.   What happens if we add another great circle?  The diagram begins to get a little busy.
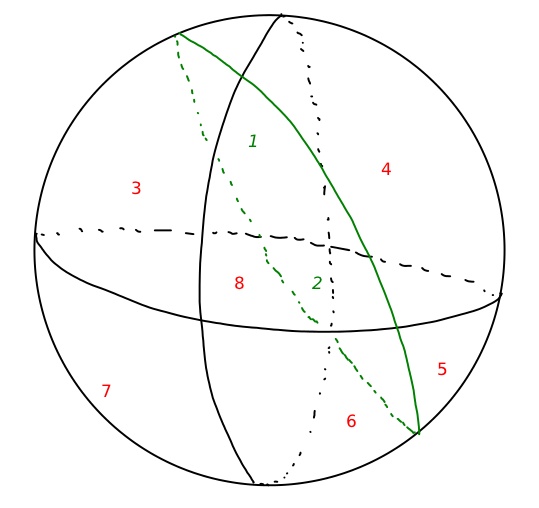
Three great circles separate a sphere into 8 regions

Three great circles separate a sphere into 8 regions

Now a new great circle has been added in green.   The red numbers should be “seen” as being on the front of the sphere, whereas the green italicized numbers should be seen as being written on the “inside” of the sphere (to label regions that are mostly on the back).

What we have now is just a somewhat skewed version of the well known fact that three planes with one common point divide space into octants (whereas two lines divide a plane into quadrants).

Notice that up until now, each time we’ve added a new great circle the number of regions has doubled.  It might be natural to think that this pattern will continue, and that if we add a fourth line then the sphere will be divided into sixteen regions.   Let’s add a new line and see.  The diagram is starting to get a little confusing!
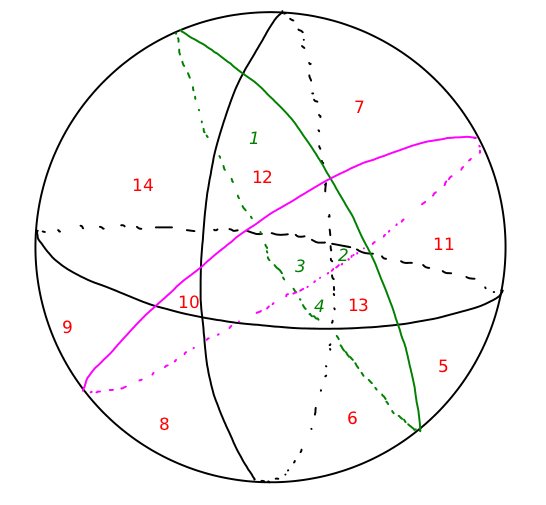
Four great circles divide a sphere into 14 regions

Four great circles divide a sphere into 14 regions

Like in the previous diagram, you should see the red numbers as being written on the outside of the sphere, and the green numbers as written on the inside.  It looks like the doubling rule has turned out to be misleading — this sphere only has 14 regions, rather than the expected 16.

What happens when we keep adding circles?  We could try to make another diagram, but finding all the regions might be difficult! It seems easier to let reason take over at this point, and give the pictorial part of the brain a rest.

How can we do that?  One powerful fact we have is that two great circles intersect at two points.  It’s not quite clear how to use this, though.  Fortunately a lot of the hard thinking in this problem has already been done in the form of the Euler Characteristic.

We can define an intersection point of two great circles to be a vertex (V), and call any circular segment connecting two vertices an edge (E).  Then the regions bounded by edges will be called faces (F).  Euler’s polyhedron formula promises that our sphere (with any number of great circles) will always satisfy:

V-E+F = 2

So far we have:

Diagram 1:  V = E = 1 and F = 2

Diagram 2:  V = 2, E=4 and F = 4

Diagram 3: V = 6, E =12 and F =8

The values of V,E and F for the 4th diagram aren’t so obvious. Let’s try to figure them out carefully, so that our eyes don’t play tricks on us.

Pick one circle to focus on.  This intersects each of the other three circles in two places to generate 3×2=6 vertices.  Now, ignoring this circle and picking another circle, that circle intersects each of the remaining 2 circles in 2×2 = 4 new vertices.  Now throwing that circle out as well, there are two circles left, contributing a final 2 new vertices, for a total of 6+4+2 = 12 vertices.

We can count edges too.  Fix your attention on just one circle.  Notice that it should contain 6 vertices, two for each of the other three circles (because it intersects each of these twice.)  A circle with 6 points on it is divided into 6 pieces.  Therefore each circle contributes 6 edges, for a total of 4×6 = 24 edges.

I don’t know a simple way to reason out the number of faces, so let’s just say that by inspection we found that there were 14.

Notice that for each of the four diagrams, the Euler Characteristic formula for the sphere (vertices – edges+ faces = 2)

V-E+F = 2


applies:

1 - 1 + 2 = 2


2-4+4 = 2


6-12+8 = 2


12-24+14 = 2


Though counting faces seems to be hard, we can count edges and vertices for any number of circles fairly easily.  This means that we don’t need to count faces, because the Euler equation easily gives F = 2-V+E.  All we need to know is the formula for the number of edges E and the formula for the number of vertices V .

 

Following the reasoning we used for the 4th diagram, if there are n great circles, then the number of vertices will be

V = 2\cdot(n-1)+2\cdot(n-2)+\cdots+2 = 2\frac{(n-1)n}{2}


Similarly, there will be

E = n\cdot 2\cdot(n-1)


edges.  We can now find the number of faces by using the Euler Characteristic:

F = 2-V+E =2 - 2\frac{(n-1)n}{2} +n\cdot 2\cdot(n-1)


or

F = n^2-n+2


This tells us that the number of regions into which n great circles divide the sphere grows roughly as the square of the number of circles.  We can also compute particular values.  Though no one would probably ever want to count to check, with n = 100 great circles, there are 9902 regions.

This completely solves the problem of region counting with great circles on a sphere.  What’s next?

We now want to move away from the sphere for a moment and ask a seemingly unrelated question about arrangements of lines in the plane.

Just like we only used great circles in the sphere, we only want to consider “nice” arrangements of lines.  We don’t want any of our lines to be parallel, or any three of them to intersect at the same point.  Our line configurations are supposed to be “generic”– what you would get by picking a bunch of lines randomly.


Now, let’s try to play the region counting game with the plane.  Here are some pictures to get us started.
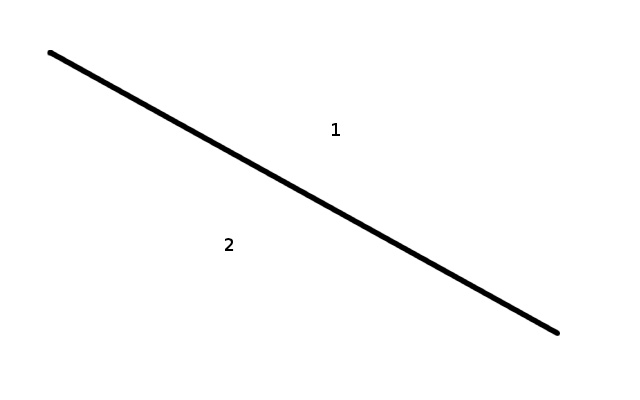
 

A line separates the plane into two regions
A line separates the plane into two regions

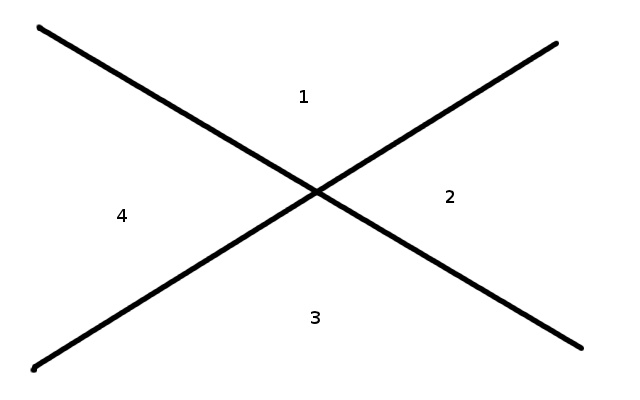
Two lines separate the plane into four

Two lines separate the plane into four


Three lines separate the plane into seven
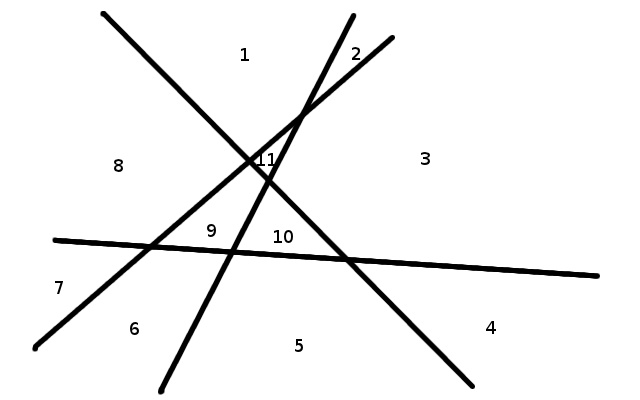
Three lines separate the plane into seven

Four lines separate the plane into eleven

It’s clear that the plane is giving us values that are different from the sphere.  The numbers 1 (for no lines), 2, 4, 7, and 11 may at first seem to be random, but there is a subtle pattern.  These numbers can be seen as coming from Pascal’s triangle:
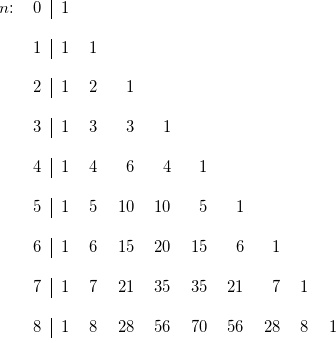
Pascal's triangle
Pascal’s triangle

In Pascal’s triangle, the entry in row n and column c comes from summing the entries directly above and to the left of it.  For example, 35 = 15+20, and 10 = 6+4.

We are looking for a way to connect the entries in the number sequence 1,2,4,7,11 to the entries in Pascal’s triangle.  We can do this as shown here:
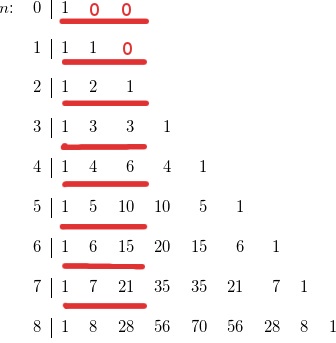
Pascal's triangle, the first three columns
Pascal’s triangle, the first three columns emphasized

If you sum the elements in the first three columns in each row of Pascal’s triangle, it produces the number sequence 1,2,4,7,11,… which perfectly matches the sequence we got by making regions in the plane.  If you experiment, you will see that the pattern continues to work even for n > 4. Could this pattern give the number of regions in any arrangement of lines?

Our experience with trying to guess the number sequence for the number of regions in the sphere should have made us cautious.

How can we go about finding the formula for the number of regions made by n lines in the plane?

Maybe we can use the Euler characteristic again.  Unfortunately it’s not clear how, because the lines in the plane are infinite, and anyway if you check you can see that the formula

V-E+F=2

no longer seems to hold.  At the same time, it doesn’t seem like the plane is so different from the sphere.  In fact you can connect the two using a technique called stereographic projection.

Stereographic projection from the sphere to the plane

Stereographic projection gives a way to map the sphere onto the plane (which we imagine as being beneath the sphere).   The idea is that there is an infinitely tiny “lighthouse” located just at the north pole of the sphere. This tiny lighthouse shines through the sphere and “projects” all of its parts onto the plane beneath.  Notice that points on the sphere which are close to the north pole get sent very far away, and that the north pole itself never gets mapped to the plane.

What kinds of curves on the surface of the sphere will get mapped to lines in the plane? If you think about this for a second the answer will probably come to you:  circles (not necessarily great circles) on the surface of the sphere which pass through the north pole become lines in the projection:
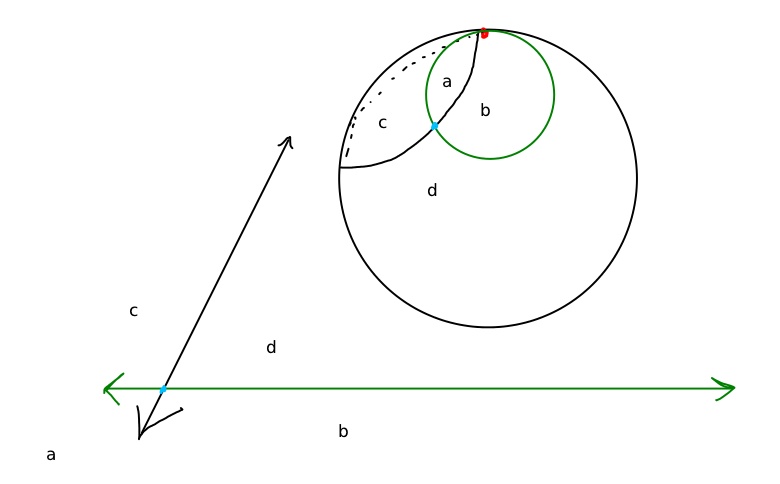
Projecting circles from the sphere to the plane

This is difficult to draw, so please forgive my crude figure.  The diagram above shows two circles on the surface of the sphere being mapped to lines under stereographic projection.  The letters indicate how regions on the surface of the sphere (resulting from the arrangement of circles) translate to regions in the plane (resulting from the corresponding arrangement of lines. )

It is fun, to explore this line making machine.  How do you get parallel lines in the plane?  Perpendicular lines?  A moment’s thought should convince you that parallel lines in the plane “are” exactly the circles on the sphere that never intersect (except at the north pole).  Since we are only working with “nice” arrangements of lines, parallel lines are not allowed–we only need to be aware of them to avoid them.

It probably will not even occur to you to worry that the number of regions you get on the sphere with circles through the north pole is different than the number of regions you get in the plane with the corresponding lines.  The picture makes it pretty plain.  You can shore up your doubts by reflecting on the fact that stereographic projection is continuous, and so it preserves connectedness of things like line regions.

Now, we can answer our question about line regions in the plane by using the Euler Characteristic on the sphere again!  In fact, if we just remember to add one extra vertex (for the north pole) we can just count edges and vertices in the plane.

So our new planar formula is :

V+1-E + F = 2

or in other words

V -E + F = 1

Now, each line intersects each other line exactly once, and this breaks each of the n lines into n pieces.  Therefore

E = n\cdot n = n^2

The vertices can be counted as follows.  Fix one line.  It intersects each of the other n-1 lines.  This gives n-1 vertices.  Now discarding this line (to avoid double counting) and repeating this argument on the “next” line, we get n-2 more vertices. Continuing in this fashion, the number of vertices must be

V = n-1 + (n-2)+\cdots +2 +1 = \frac{(n-1)n}{2}

Putting everything together,

F = 1 - V + E = 1 - \frac{(n-1)n}{2} + n^2

or

F = \frac{n^2+n+2}{2}

This can also seen to be equal to the first three binomial coefficients \binom{n}{0}+\binom{n}{1} + \binom{n}{2}, confirming the conjecture about Pascal’s triangle.

Posted in Uncategorized | 95 Comments

The Apocalyptic Quaternion

The feelings that I associate with Quaternions (which I will persist in capitalizing, as an homage to their 19th century origins) are not really professional. I see them as a Victorian curiosity; the kind of thing that might be referenced in an Alan Moore comic, or kept under a bell jar in some museum with lots of wainscoting.

For the non-mathematical reader, the Quaternions are something like the complex numbers, except that they have three imaginary elements instead of just the usual i = \sqrt{-1}. For me this gives them a kind of Spinal-Tap like property of super-abundance – this number system goes up to three.

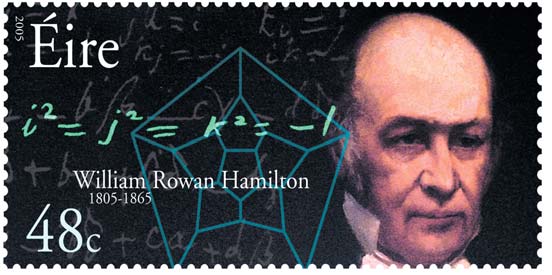
Whereas in the complex numbers we have to be satisfied with only one weird relation, namely i^2 = -1, in the Quaternions we get three times the mystery. In addition to i, there are two new letters j and k with the property that

i^2 = j^2 = k^2 = ijk = -1.


Hamilton

William Rowan Hamilton

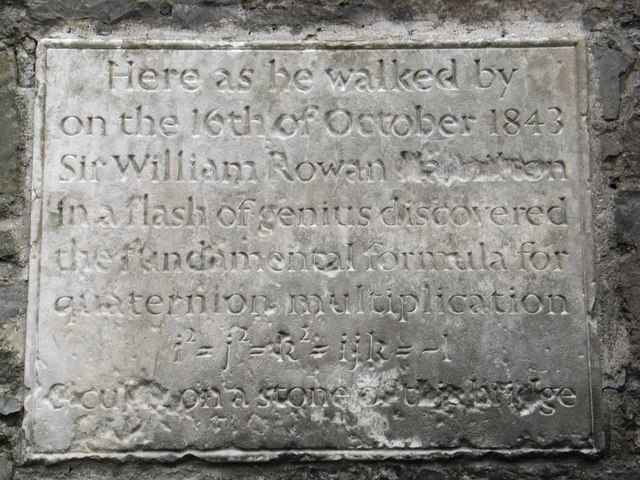
The inventor of Quaternions, William Rowan Hamilton, carved this relation into Brougham (Broom) Bridge in Dublin, where he happened to be when he had his revelation.

A person who hasn’t had a year of Abstract Algebra may be puzzled as to why Hamilton’s relation is better than any other relation you might make up with some letters from the middle of the alphabet.

Why not achieve mathematical immortality by advancing the more awesome looking relation

i^2 = j^2 = k^2 = 666

?

The miracle that occurs in Hamilton’s relation is that the product (and quotient) of two Quaternions is another Quaternion.

For instance if you multiply out 2 +i -3j +2k and -1+7i-3j+4k, using the normal rules for multiplying multinomials, you get


7 \, i^{2} - 24 \, i j + 18 \, i k + 9 \, j^{2} - 18 \, j k + 8 \, k^{2} + 13 \, i - 3 \, j + 6 \, k - 2


Using Hamilton’s relation, this simplifies to

-7 -24k-18j-9-18i-8+13i-3j+6k-2


or in other words the Quaternion

-26-5i-21j-18k


Something similar happens when two Quaternions are divided.

Who cares? One reason to care is that providence didn’t equip the universe with too many systems like the Quaternions. They are one of a small beastiary of magical structures. If you’re looking for something that you might naturally call a “number system” (with finitely many dimensions) that contains the real numbers, your options are four (Hurwitz’s theorem):

\mathbb{R}, \mathbb{C}, \mathbb{H}, \text{ and } \mathbb{O}


Here \mathbb{R} is the real numbers, \mathbb{C} is the complex numbers, \mathbb{H} is the Quaternions (after Hamilton), and \mathbb{O} are the octonions. Each of these contains all the previous systems as a subsystem, so that the most universal is \mathbb{O}, and the smallest is \mathbb{R}. They also get progressively more strange, and their multiplication becomes harder to recognize as “multiplication.” For instance in \mathbb{H} you lose the property that ab = ba and in \mathbb{O} you lose even the property that (ab)c = a(bc). In other words in \mathbb{O} you can’t talk about the product of three “numbers” unless you say exactly in which order you want to multiply them. In the multiplication we’re used to, “the product of 8, 6 and 4” is completely unambiguous. It is 192. But in other number systems, yelling mathematical phrases across the room would require a lot more caution and precision. You might say, “Take 4, multiply it on its right by 6, and then multiply that result on the left by 8.” And this would be necessary for the answer to be unique.

You can argue for the importance of the Quaternions on the grounds that they are “God given,” appealing to the special nature of \mathbb{R}, and the above fact about “normed division algebras” extending the real numbers. A mathematician can show that \mathbb{H} is special, provided you accept that the counting numbers are special.

It seems plausible to say that any alien race that “counts” in the same way we do would eventually have their own Hamiltonian epiphany on Brougham Bridge, despite the fact that that bridge might be made of singing crystal and arch over a body of sentient lava, etc.

But maybe this kind of “center of the universe” argument isn’t to your taste. Ironically the arrival of the Quaternions on the intellectual scene was quite disturbing. It was part of a wave of new systems (new geometries and algebraic systems) that made mathematicians question the value of traditional mathematics, and its role as the ultimate in apodicticity. Kline compares this to the way in which a person might reevaluate his cultural mores (and their claims to being absolute) after a trip abroad. In fact Kline posits that Non-Euclidean Geometry and the Quaternions were the two bullets that destroyed humanity’s optimism for finding truth in any field. (Because if there is no truth in math, then where might it be?)

But there are other reasons the Quaternions are cool.

You may know that multiplication of complex numbers has a geometric meaning. If I take two complex numbers 5+2i and -2 + 2i, I can think of them as points in the complex plane. The “number” 5+2i is the location (5,2) and the “number “ -2 + 2i is the location (-2,2). When I multiply the two of them I get a new number/location by

(5+2i)(-2+2i)=-10+10i-4i+4i^2=-14+6i


Is there a simple geometric relationship between what I got and what I started with? Yes. The number/location -14 + 6i is the point that you get by adding the angles that 5+2i and -2+2i make with the real axis, and multiplying their magnitudes (distance from the origin).
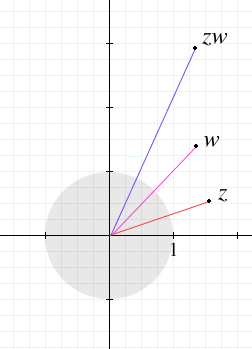
Complex multiplication

Complex multiplication

In fact it’s fun to play this game: Take a complex number, like, say, 2+i, and repeatedly raise it to higher and higher powers. If you plot the corresponding points, you will see them “spiral away” from the origin in a satisfying fashion.
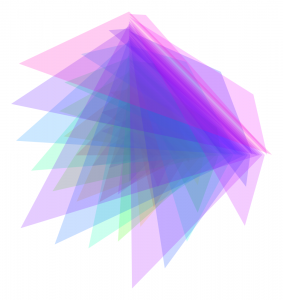
From this discussion you can see that the complex numbers \mathbb{C} have a geometry that’s closely tied to their properties as a number system. Multiplication is the same as spiraling. Adding has a pretty geometric meaning as well. The system is inherently two dimensional.

The inherent dimension of the Quaternions is 4. This makes it harder to visualize what happens geometrically when Quaternions are multiplied. Okay, it makes it impossible to visualize what happens when Quaternions are multiplied. But they can be used to describe rotations in 3 dimensional space. The easiest way to understand how this works may be to read this very good summary (and beware the less than lucid Wikipedia)

What Hamilton was trying to do actually, that day on Brougham Bridge, was come up with a 3 (not 4) dimensional analog of the complex numbers. This was a 19th century preoccupation, and so it is a testament to Hamilton’s ability that he is the one who finally broke through (evidently Gauss did something similar, but never published his thoughts.) It’s true that Hamilton missed the mark by a dimension, but by Hurwitz’s theorem he had no choice. An excellent explanation of why a 3 dimensional solution is impossible is given here.

The Quaternions had a vogue in which they were studied intensively in mathematical circles that lasted approximately fifty years. Many eminent physicists, including Maxwell, used them in their work. Intuitions developed from the Quaternions served as a basis for the theory of vectors, which eventually supplanted them. There was even a Quaternion Society, at the beginning of the 20th century. As everyone knows who has been to math graduate school, Quaternions eventually decreased in relevance. Other methods, less specifically attached to 4 dimensions, were developed and took over the role of Quaternions in applications, notably the vector methods developed by Grassmann at approximately the same time. It would be easily possible to get a degree in mathematics today and never encounter the Quaternions, or else visit them only as a relic, the way a student in biology might get to palm a bezoar, or a student in engineering might tweak a Stirling engine.

But with the advent of 3 dimensional computer graphics, Quaternions as a scientific tool came back to life. They provide advantages over other methods for computing rotations in 3-space, notably numerical stability and the avoidance of gimbal lock. You can easily find down to earth explanations of how to use them in practice, such as this one.

A survey of the organizations hosting information on the subject can be found here.

Hamilton devoted much of the rest of his life to Quaternions.

Posted in Uncategorized | 9 Comments

Who needs me, anyway? Khan Academy and the re-imagining of education

Damn you, Salman Khan, for seeing what nobody else (apparently) could see.

It all seems so simple in retrospect — we have the internet, we have youtube, we have cheap videocameras.  Mini-lectures on focussed topics,  the screen just shows the work being done, like watching a blackboard without the distracting body in front of it, and the voice track keeps it human and accessible.  All you need is great explainer at the helm, and this is where Khan Academy shines.  Instant education.

As an experiment, last semester I helped create (with my colleague, Ezra Halleck — thanks Ezra!) an “online notes” page for each lecture of our introductory algebra class (here’s an example).  The notes consisted in large part of links to Khan Academy videos demonstrating the topics we went over in class.  Confused students, struggling with homework problems, were directed there first.  I received more positive feedback from students about this than any other single online project or resource I have employed.  They loved it!  Stuck on a problem? Take 10 minutes and watch someone work out a similar problem, step by step, with careful, clear explanations.  Unclear on the concept?  Let’s talk about the big picture for a little while.  Teacher covered the easy examples but ran out of time to do any “tricky” ones?  Salman Khan will take you through a whole range of them, AND he’s not afraid of fractions.

Of course, this opens up a whole host of troubling questions — for starters, “Who needs me, anyway?”  If Khan Academy is indeed succeeding in “changing education for the better by providing a free world-class education to anyone anywhere,” then where do the rest of us fit in?   I love this question.  Yes, it’s distressing, but it’s also freeing and little bit inspiring.

  • Maybe my students can watch Sal do some of those examples instead of me rushing my lecture to get them all in.  Why is this bad?  More freedom is great!
  • What can I do in the classroom that Khan Academy can’t?  Well, I can talk back for one — sympathize, provoke, respond, apologize, wax sarcastic, and so on…
  •  What else?  I don’t know.  Khan Academy is growing every day (“over 141,324,337 lesson delivered”).  What will it look like ten years from now?  Fifty?
  • And while we’re at it, Khan Academy is just the tip of the iceberg.  Lots of institutions are putting their “education” on the web for free, with MIT leading the way.  What will come of that?
  • That’s all well and good for undergraduate education, but what about “serious math”?  Check out this user-compiled list of great mathematical videos from the folks over at mathoverflow — beware, you can easily waste a month or two in the links you find here.

I’ll close with a non-mathematical video from Khan Academy — here is Salman Khan talking about Abstract-ness:


Posted in Uncategorized | 13 Comments

SAGE

Lately I’ve been playing around with the free software package SAGE, which does a lot of things mathematical.  Though I think most people will have heard of SAGE, let me give their mission statement as expressed on their website:

Sage is a free open-source mathematics software system licensed under the GPL. It combines the power of many existing open-source packages into a common Python-based interface.
Mission: Creating a viable free open source alternative to Magma, Maple, Mathematica and Matlab.


Though SAGE does everything under the sun and has the complexity of a flying saucer, I am mostly concerned with using it for teaching at the moment.  Below I’ll go over some neat things I’ve been able to do with the software.

If you’ve never used SAGE the first thing you’ll notice is that it’s a bit of a pain to get working.  The method I’ve had success with is downloading the source and compiling it from scratch.  That’s not as hard as it sounds, and for a lot of people it’s a piece of cake, but it’s frustrating to think that this will stop a lot of people from using this really amazing software.

If you are a Windows user and want to fully install SAGE, these steps might help.

  1. Download and install the free software VirtualBox.
  2. Download an Ubuntu iso, and install it in VirtualBox, using these or other instructions.
  3. Follow these instructions in the section “Compile from Source.”

Well, at least you can feel pretty cool when you finally run it and get the somewhat anticlimactic sage prompt greeting you from the command line:

sage:

So what do you do with that prompt?  The first thing you probably want to do is run the command

sage: notebook()

which will give you a slightly more graphical interface.  From there you can go on to use the control SAGE gives you to make the most beautiful mathematical plots you can imagine.

Look at this for example:

A SAGE plot

A SAGE plot

With this example and the others to follow, if you click on the image you can see the code used to generate it.  The above image is taken from an example in the SAGE documentation.

As a tool for making plots for exams, quizzes and notes (even textbooks?) SAGE compares very favorably with MAPLE.  (I have to confess I have very little experience with Mathematica.)  While SAGE lacks the “right click” easiness of MAPLE, certain things are more natural, mostly owing to the beautiful Graphics() object supported in SAGE.  These objects can be “added,” as shown below, to produce highly customized diagrams.

To give an example, suppose you want to show your students the area bounded by the curves y=x^2 and y=x^3-2x.  Then with the following commands, you get the picture below.
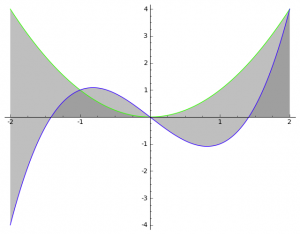
var(‘x’)
p1 = plot(x^2,(x,-2,2), hue = “.3”,fill=true)
p2 = plot(x^3-2*x,-2,2, hue = “.7”,fill=true)
p1+=p2
p1.show()

A sage plot

A sage plot

One thing that makes the usage natural is the way you can add plots (technically Graphics() objects) and delay showing them.  When they are “shown” they can be shown with a variety of options.

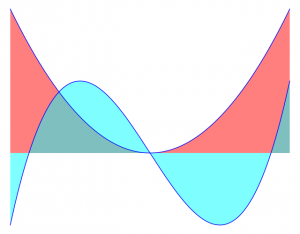
Here is another method for producing a similar picture which is a little more visually pleasing (click for SAGE code)

A sage plot

A sage plot

What’s more, it’s easy to export all of these things to a variety of file formats.

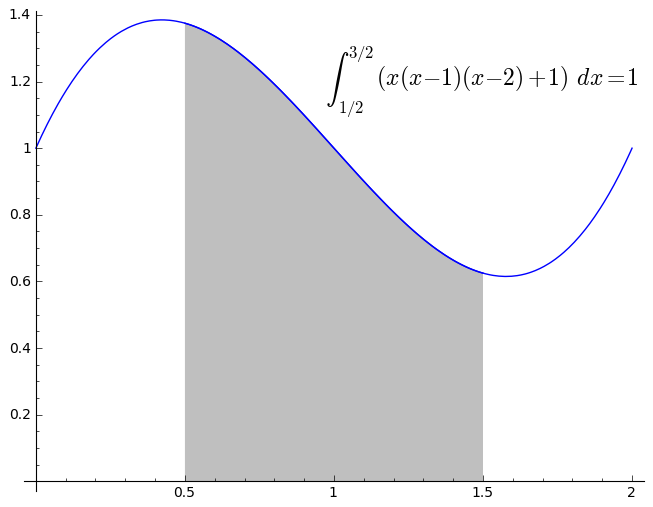
You may want to add text to your pictures (even LaTeX) as in the following.

A SAGE plot

A SAGE plot

If you examine the code for the above image, you can see that the integral was automatically TeXed by SAGE, and plotted at coordinates that I was able to choose.

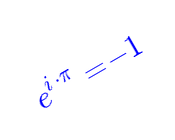
You can even control the rotation of text.

Rotated Text

Rotated Text

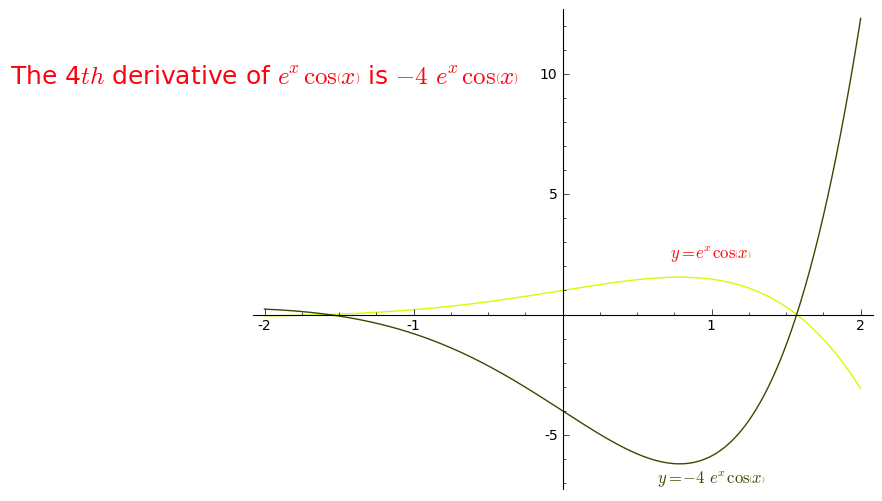
If you have to compute something onerous, you may want sage to do it for you, like in this example.

Dynamic math

Dynamically generated math text

If you examine the code for the above image, you can see that it was SAGE which computed the 4th derivative of the function.  Note also that the label locations on the curves were plotted by using the actual functions!

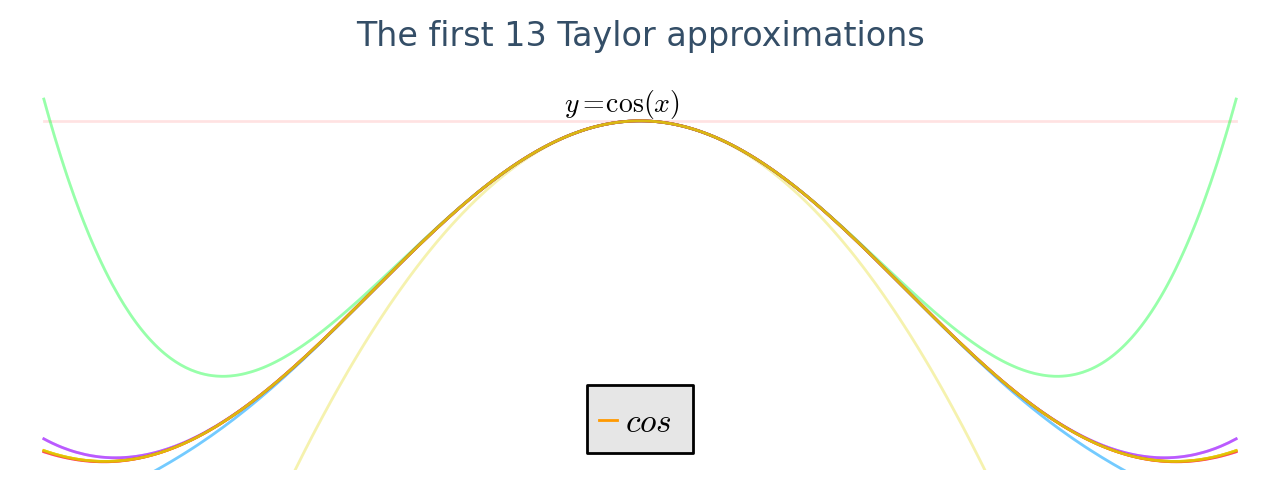
More power is added to the graphing capability by using SAGE’s ability to iterate.  Here are the first 13 Taylor approximations to cosine around the origin:

Approaching Cosine

Approaching Cosine

If you examine the code for the above image you can see that the 13 Taylor approximations are not hard-coded, but rather produced by a repeat loop.  It would be a simple matter to make the number of approximations shown 130 rather than 13.  Also note that I am using the counter variable to control the transparency (ie alpha) of the curves drawn, so that the lines appear to become more solid as they become closer approximations.  The hues of the lines are also changing as a function of the counter variable, and produce a nice spring palette.

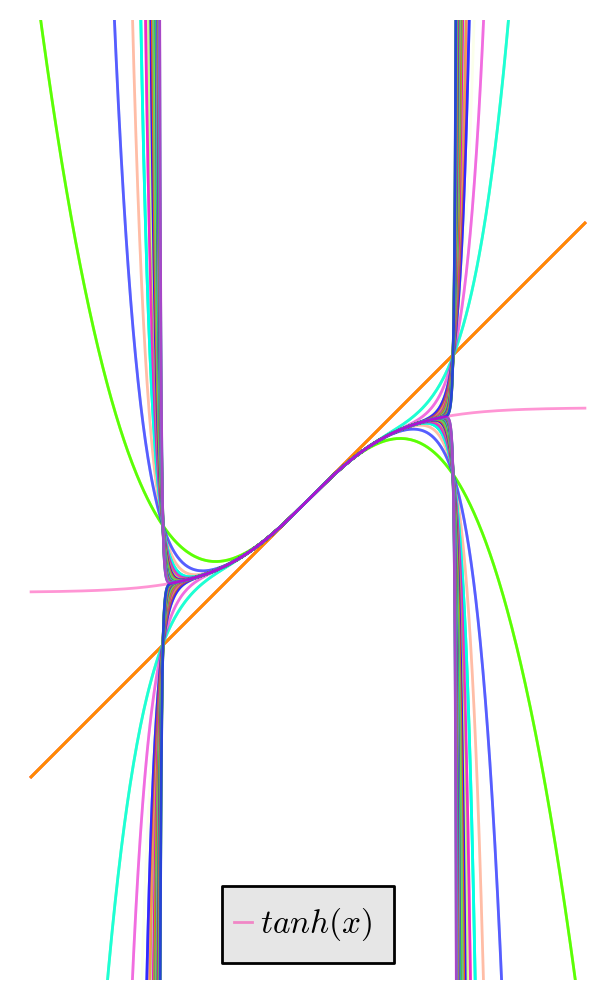
Something similar with hyperbolic tangent becomes a lesson in radii of convergence.  Here are the first 100 Taylor approximations to \tanh(x) near the origin.

Converging (?) to tanh

Converging (?) to tanh

Though I have not done so, it would be simple to use iteration to make direction field plots of arbitrary resolution, for use in explaining differential equations.  This might even be a good (too challenging?) exercise for the students.

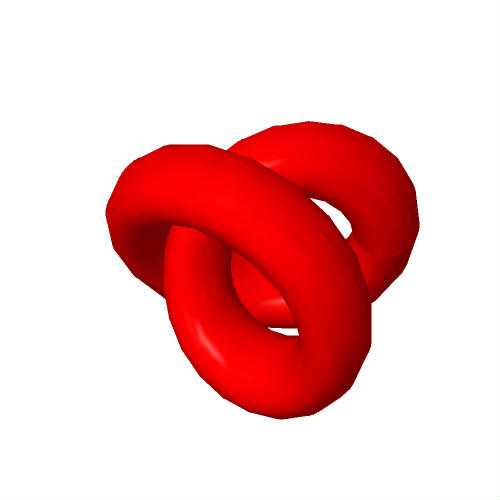
SAGE also supports 3d plotting.  The 3d image manipulation program works far better than the corresponding application packaged with MAPLE.  There is a way to import the resulting Java application into a web page, but I will just supply still images here:

Still Twisted Torus

Still shot of a twisted torus

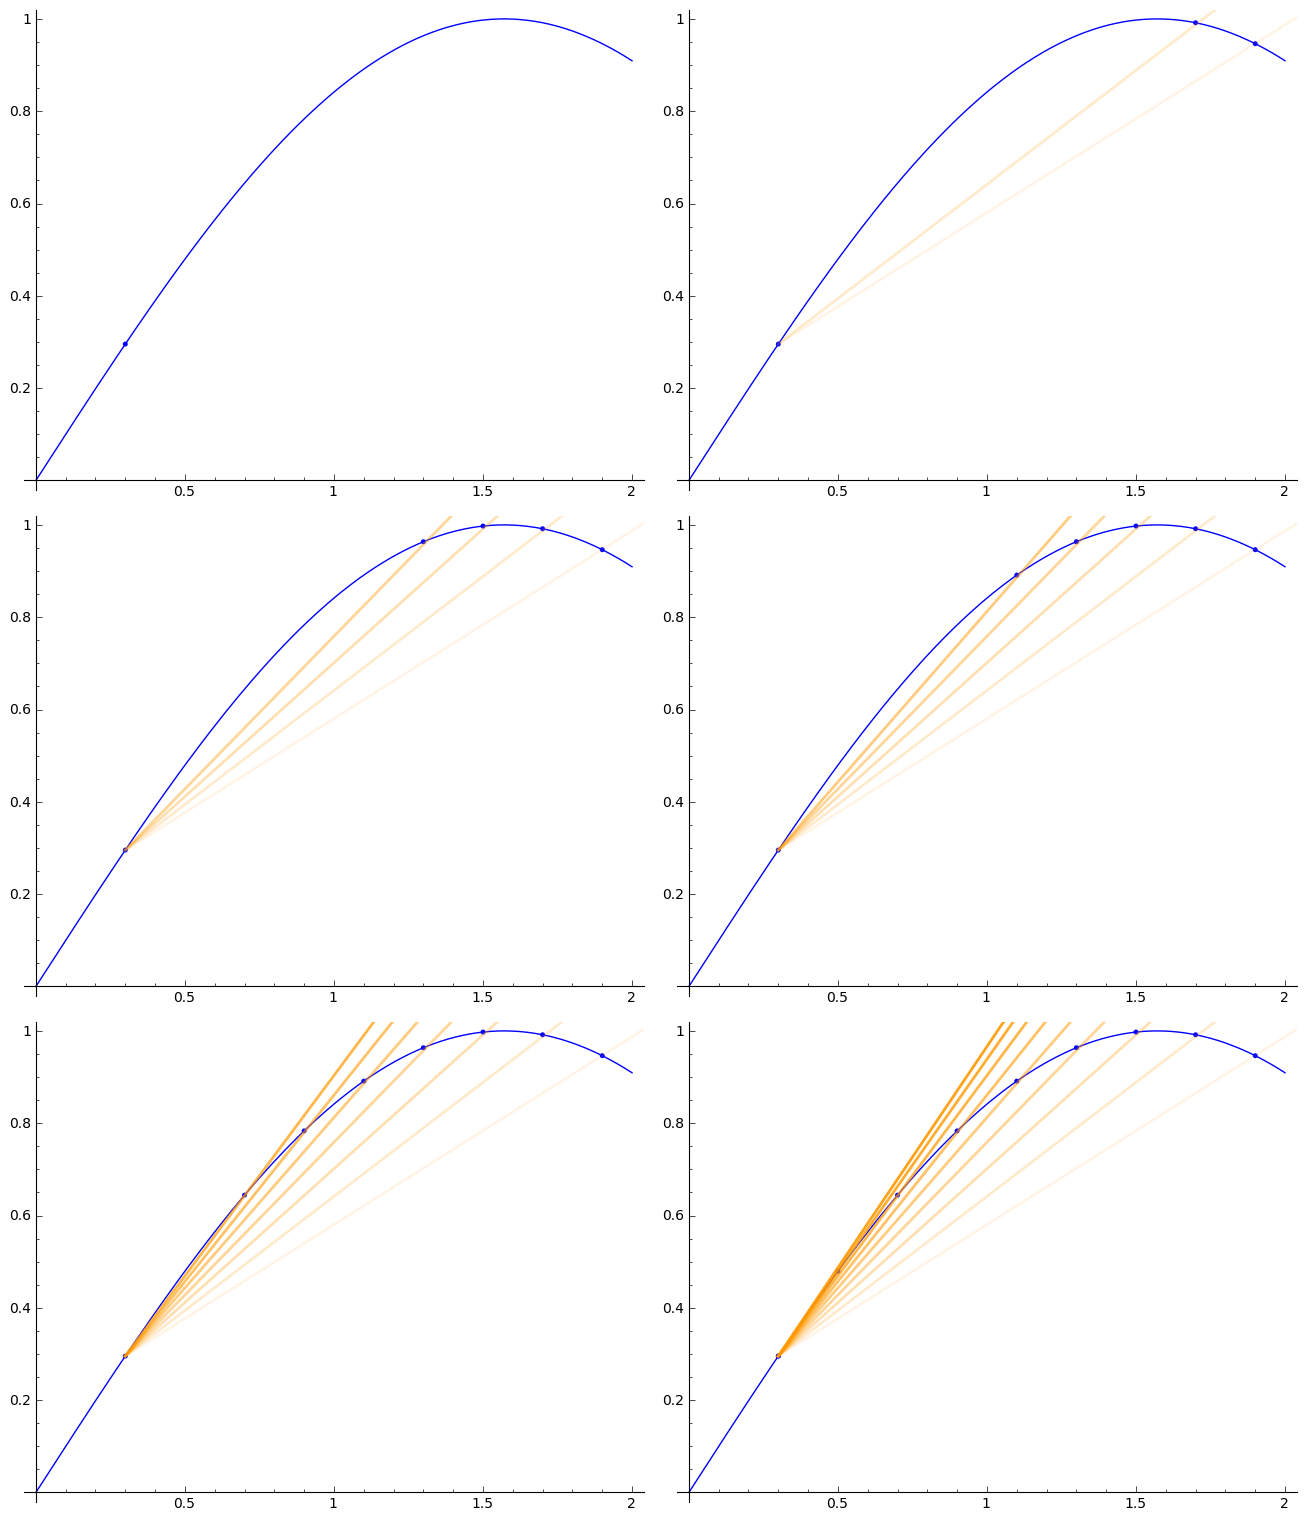
The ability to iterate can also be used to produce animations.  This capability is highly flexible, and can be used to make animated gifs, or even export movie files.

The secant line becomes the tangent

The secant line becomes the tangent

If you examine the SAGE code for the image above, you can see that the program is performing an intriguing kind of “continuous” iteration, in which all x_i = a+i\cdot\Delta x are generated for a given \Delta x and interval [a,b].  The motion tends to give me a headache, but I thought I had to show an example! Scroll down!

Lastly I wanted to say a few words about SageTeX. It is useful to be able to use SAGE from within LaTeX for the following reasons:

  1. You can produce figures on demand, without exporting, converting to jpeg, etc, which can all be very tiresome.
  2.  You can use SAGE to actually compute within your document, reducing the chances of errors in calculation and saving labor.
  3. Certain objects, like matrices, can be a pain to typeset, but this can be done automatically using the SAGE latex() function.  This function takes a SAGE object as input and outputs a latex description, so that, for example,

sage: a=matrix([[1,2,3,4],[5,6,7,8],[9,10,11,12]])
sage: latex(a)

\left(\begin{array}{rrrr}
1 & 2 & 3 & 4 \\
5 & 6 & 7 & 8 \\
9 & 10 & 11 & 12
\end{array}\right)

can be automatically generated.

The full power of SageTeX is nicely illustrated by a file called example.tex which can be found in

$SAGE_ROOT/local/share/texmf/tex/generic/sagetex

assuming you have succeeded in installing SAGE.

I can not help but editorialize that installing and using SageTeX took me approximately 4 hours of hair tearing frustration — it is comparable in difficulty to capturing the pegasus.

Only those with a fair amount of Linux expertise are likely to accomplish this goal, so let me briefly list some lessons learned in unabashed jargon.  I will not touch on anything covered in the instructions given in the above website, but explain a few things which were *not* covered.  Everything is with reference to Mint, but I assume Ubuntu is sufficiently similar that the following are still relevant.

  1. The file you need to edit to export new environment variables (eg SAGE_ROOT) is /etc/bash.bashrc
  2. The command env will list all environment variables.  You will probably need to do a couple env | grep SAGE and env | grep TEX commands as you go along.
  3.  You can see the current value of an environment variable, for instance SAGE_ROOT, by executing echo $SAGE_ROOT
  4. When you installed texlive it probably included a version of SageTeX which it has hidden in your directory structure, possibly here:  /usr/local/share/texmf/tex/generic/sagetex.  Unfortunately the version of SAGE expected by those files is probably not the same as the version of SAGE which you have.  This is a problem, because the system does not work when there is a mismatch.  Therefore you either have to move the old files so that latex cannot find them (and finds only your new files) or simply replace the old SageTeX with the new one.
  5. Once all the above is done, you use SageTeX by first latexing a document (for instance fun.tex), and then running SAGE from the command line on a generated file called fun.sagetex.sage.  You are then supposed to run latex on fun.tex again, and then you get the desired output file.  This *almost* works.  In my case I got errors because an automatically generated python script fun.sagetex.py which is invoked by fun.sagetex.sage looks for a non-existent file fun.sage.  All will be well if *before* you do sage fun.sagetex.sage on the command line, you first do cp fun.sagetex.sage fun.sage.  You will need to repeat this process every time you want to recompile fun.tex.

Technical problems aside, SAGE is an amazing software package, which has many applications.  The fact that it is freely available means that it is not only free to us, but also to our students.  When showing our students how to accomplish a technological feat we frequently have to choose a platform to teach them on (eg Linux vs Windows).  There are ethical arguments which can be made that we are obligated to instruct them on the “most free” platform so that they are not “born dependent” on technology produced by a particular company.  I believe this point carries water, but even if you disagree there are purely utilitarian reasons to teach our students on open source platforms when possible:

  1. The students will always have free access to the product
  2. Usually the open source version better shows the basic operational principles of what is happening
  3. Free and open source technology does not quickly become obsolete or stop being supported when a certain company fails or goes bankrupt.  It is always around.

As I have said above, the cost of getting started in SAGE is relatively high, but I believe the technology is ultimately superior, to MAPLE at least.  There are the open source/ free software arguments which can be included as a bonus incentive.


Posted in Uncategorized | 30 Comments

South Indian Cuisine with Professor Laurence Kirby

Professor Laurence (Laurie) Kirby at Baruch College has a couple of places in cyberspace, including his faculty bio, his own website and blog, to express his interests. Skimming through their contents, I got my eye caught by the sentence, “What is the relationship between language and reality?” posed in his bio as one of his research questions. Although what was primed in my mind (e.g., “Can the word ‘sad’ fully represent the reality of ‘sadness’?”) seems to be quite different from what he has been studying (the relationship between “the formal ‘language’ of arithmetic and the ‘reality’ of the structure of the natural numbers such as 0,1,2,3, etc.”), finding such a philosophical question in a math faculty bio was highly intriguing.

First of all, thank you for recommending this restaurant for our interview. I was looking around and having a sneak peek of what people are eating. The food looks amazing! This is what I was hoping for because Gramercy (where Baruch College is) is known for a plethora of good Indian restaurants.

You’re welcome. It’s a bit noisy but this place has good food.

Do you like and are you willing to try all kinds of different food?  Reading in your bio that you got your degrees from Cambridge U and Manchester U, I’ve gathered you must be from the UK.

That’s correct, but I was actually born in Hong Kong. My father was Professor of Economics at Hong Kong University. We were there until when I was 12 and then moved back to England.

Hong Kong! Do you think that early experience cultivated your curiosity and interests in different cultures? I read in one of your blog posts about cultural differences in “how people draw a triangle.” It was fascinating.

I think my experience in Hong Kong had a large influence on me. And yes, when told to draw a triangle, most of us will draw an equilateral triangle with the base on the horizontal axis. Eleanor Robson in her article Words and Pictures says that in ancient Mesopotamia, people would draw an elongated triangle with the base on vertical axis.  She argues that even a basic concept like triangle is, in part, culturally determined.

It’s great that a math professor is interested in lots of things other than math also… traveling, eating, literature, and such. You’re also a musician. What instruments do you play?

I play the violin and piano. The violin is my instrument, though. My mother would play the instrument and as a child I really wanted to be able to play it. I had a very strict but good teacher. Now I sometimes play at a local bar/restaurant, and I actually will on this St. Patrick’s Day.

That’s super! By the way, what’s the difference between the violin and the fiddle?

Musicians’ attitude. The instruments are basically the same.

So you’re a fiddler with an attitude?

That’s right!

I can see that what you are have been enormously influenced by your professor father and musician mother. You also had a good violin teacher… How about math teachers?

My math teacher in high school was probably the best teacher I had.

Did she or he influence you a lot in terms of choosing math for your profession?

Not at all (laugh). I always wanted to be a musician!

Okay (laugh)… Going back to your family, you and your wife both play music and you have two sons, who are college students now.  What do your sons want to be when they grow up?

I don’t know, but they both play music. The younger one is a drummer in a heavy metal band (laugh). The other one writes and plays music. He has a good taste for music, too, like the Beatles and…

Timeless! I love them. I have lots of their albums on my iPod.

I actually saw them play! They came to Hong Kong when I was 11.

Wow…

Talking about his plans to visit his family in Manchester and other cities in the UK this summer, he told me that his family there consider him too “Americanized” (he has been with Baruch for 30 years!). To me, he appeared to be a very well-mannered and quiet Englishman, but then again I didn’t get to elicit his persona as a fiddler. I may need to go see him play music sometime.

(This interview was conducted on March 15, 2012, right before St. Patrick’s Day.)

Posted in Uncategorized | 13 Comments

Totally Disconnected

Last week I went to two talks on my campus.  One was by Richard Stallman, one of the founders of the GNU project and thus a co-inventor of Linux. The other was by the Nobel-prize winning economist Amartya Sen.

Both talks were sparsely attended considering the fame of the speaker.  At the Stallman talk there were old Gandalfian hackers and a few graduate students from our Forensic Computing master’s program.  There were faculty who were experts on cyber law in attendance, moving their heads in silent agreement or disagreement at this or that remark.  In the auditorium where Sen spoke nearly half the seats were empty, but the faculty were well-represented. Attending with my friend from African Studies, I sat next to a group from the English department, not far from a contingent of philosophers.  I also saw a few historians and psychologists, and a student of mine from the economics department.

At neither talk were there many mathematicians.  I found this a little disappointing, but not surprising. For myself, the talks were challenging and more or less pleasant, but the things discussed were completely irrelevant to my research in mathematical logic.  The same was true for other people in my department, and so I can understand why they might choose to spend their time doing other things.

I observed, a little enviously, that this was not at all true for my colleagues.  The remarks Stallman made about the role of software in a free society, and his views on the morally permissible uses of intellectual property, have relevance to work in criminal justice, economics, political science, philosophy and other fields.  He talked about current and possibly future legal conflicts between institutions and corporations with real significance to society and our technological mode of life.

Amartya Sen spoke on the nature of a just society, and as he spoke my friend and neighbor made furious notes, remarking on the material under his breath.  Some comments about the Rawlsian theory of justice and a recent declaration of food as a human right in India generated particular excitement. These were interesting observations and developments, which might in one form or another be incorporated into his future research.

To a weak but detectable extent at both talks, I felt like the campus with all its faculty was being unified by engagement in a single discourse.  Unfortunately it was a discourse in which mathematics, and in fact all the sciences, seemed without a place.  The things discussed and the forms of their discussion were disorganized, rhetorical and imprecise.  It was the kind of thing that many of us privately dismiss as “humanities nonsense,” in which the personality of the speaker figures largely and the cogency of what is being said is dubious.

But even though it is possible to console ourselves with a little chauvinism and a possibly well-earned feeling of self-righteousness, the lack of contact between math and other disciplines is still frustrating.  If nothing else, it would make life more interesting if the mathematics department were more actively and naturally involved with other groups.  As time goes on this difference seems to be becoming only more hopeless and pronounced.  We can and do make our livings teaching mathematical techniques from the 17th century to college students pursuing other majors.  But the real living core of what we do is invisible.  As is only natural, most people from other realms make no effort to seek it out or understand it.  Generally, we make no attempt to exposit or explain it.  What can we do besides watch this growing rift with increasing unease?

What is the traditional fate of the individual who bases life on a relationship with the transcendental rather than the social?  I believe that they tend to be burnt up or shot full of arrows, in proportion to how vocally they express their views.  At many colleges I feel the mathematics department has particularly neglected needs, and what could be less surprising given our state of isolation?

Posted in Uncategorized | 44 Comments

Everything Right is Wrong Again: the death of discovery-based learning?

I have never had any formal training in “how to a teach” — my own graduate studies, for better or for worse, were purely mathematical — and although I do expend a little energy towards keeping up with the world of education, I still find myself blindsided on occasion.   Most recently, by the article Putting Students on the Path to Learning: The Case for Fully Guided Instruction, appearing in the current issue of AFT’s American Educator magazine.  The thesis seems to be that, after 50 years of championing discovery-based learning, the educational establishment is changing its tune.  Fully guided instruction is the “it thing”, with exploratory learning appropriate only at the higher levels of study in any given discipline.  WOW!  This runs so contrary to my own indoctrination I had to check the cover to make sure I wasn’t reading the Onion by mistake.

Is the issue more subtle than that? Of course.  For example, lest the reader think that we are reverting to a pure “chalk-and-talk” model, the article makes a point to distinguish between independent student work and discovery-based learning, and extolls the value of the former (following the full, clear exposition of the topic at hand).

The pendulum and the pit

My more senior colleagues are less surprised than I at this turn of events — with their longer-scope experience, they see it as just another swing of the pendulum, and they take it in stride.  For me, the image this stirs is Poe’s Pendulum —  in my mind’s eye I see our students, huddling by the pit, watching the blade inexorably drop.

Posted in Uncategorized | 34 Comments

Searching for Lakatos

Should a textbook always give the whole truth?  Being sticklers for detail, as mathematicians generally are, the answer would seem to be an obvious “yes.”

In some cases it’s even difficult to imagine what the “partial truth” would be.

But in other cases it’s equally obvious that certain things would be easier to absorb if a few pesky details were forgotten (like a few hypotheses of a complicated theorem.)

For the purposes of discussion let me frame (probably in caricature) two opposite pedagogical philosophies:

P1:  The best way to teach a mathematical topic is to start with a concise definition of the object under discussion.  The technical definition may be bewildering at first, but after using it (and the accompanying theorem) students will become acclimatized, and feel comfortable with the concept.

P2:  The best way to teach a mathematical topic is to start with a picture or generic example of the situation under discussion.  Once the students have the basic idea, you can give them the accompanying technical jargon, which then won’t seem so bewildering. You can later point out possible exceptions to the generic case, if any exist.

I have used both of these strategies successfully as well as unsuccessfully. Usually I have to consciously employ the P1 strategy, as my natural impulse as a teacher is to show the students the “picture in my head” that’s relevant to the topic at hand.

I think it’s fair to characterize the P1 strategy as “modern” in the sense that there is a reduced emphasis on semantics and geometry, and a corresponding emphasis on formalism and deductive technique.  To frame things in terms of algebraic geometry, the formulas are what is “real,” and the corresponding geometric objects are “manifestations” of the syntax.  The geometric aspects are shadows of the equations, and may vary with context and point of view.

It is tempting to characterize the other approach, by contrast, as “romantic”: the geometric objects exist in the principal reality, and are of primary interest. They are mysterious or transcendental in character. The associated syntactical objects (i.e. equations) are a necessary but rather cold way of coming to grips with them, like a pipette or a strip of litmus paper. Moreover, the exact formal statement of what is being exhibited is not necessarily more valuable than a kind of non-linguistic geometrical insight.

A professional mathematician sees the symmetry between geometry and algebra, but we should be conscious that our students are getting a viewpoint that is heavily biased in favor of algebra.  We teach them to calculate numerically, and then to manipulate unknowns represented by letters.  A few years later, algebraic expressions suddenly become “functions”, and then these functions start emanating “graphs” like smoke from a choo choo train.

We do not, by contrast, start with a directrix and a focus, construct a parabola, and then exhort our students to find an equation that models the curve.  The parabola comes to x^2, not the other way around.

There is a definite efficiency to this approach.  But there is a downside:  it industrializes the production of geometric forms, and consequently cheapens them.  The hyperbola is no longer a sort of friend that steps recurrently in and out of the student’s life at different stages in their education. It is just one more of an enormous array of cheaply produced graphs, which are without inherent importance.

Be that as it may, there is another noteworthy difference between P1 and P2.  The P1 approach must capture the exact truth, whereas P2 may capture the “essence” of the truth.  I do not mean that the P2 approach is less mathematical.  I mean that when something is defined ostensively it is never completely clear what rule is being exhibited.

A natural example can be found in the introduction to Armstrong’s Basic Topology.  He presents a variety of polyhedra, and states the Descartes-Euler theorem, namely that the number of vertices (v) minus the number of edges (e) plus the number of faces (f) is always 2.  In other words, v-e+f = 2.  From the obviously large and diverse number of cases for which the formula is correct, it is immediately clear that a significant regularity has been discovered.  On the other hand, since the rule is given as an example, the ultimate class of objects to which it applies is not exactly clear.

To discover the precise truth, we must undergo a long dialectical process in which P1 style correlates of the theorem are proposed and rejected.  This in fact happened in the real history of Euler’s theorem.  This historical dialectic was translated into a dialogue in the book Proofs and Refutations, by Imre Lakatos (which appeared in print three years before Armstrong’s.)

Lakatos sees scientific (and mathematical) progress as a dialectical process of theory and counterexample.  He also advocated that this is the format in which mathematics should be taught.

We tend to “catch students up” on the dialectic to date by summarizing its history in complicated caveats.  The mean value theorem is true if f is differentiable on (a,b) and continuous on [a,b].  How many students ever really come to understand the purpose of these hypotheses?  How long would it take to cajole the class toward a notion of a non-differentiable point on a curve?

Does the student who does not know that a curve can have problematic singularities eventually come to realize it?  I think probably so; critical points are not particularly exotic monkeywrenches.  Perhaps the material presented in class should be just as sophisticated as the students can make it, with the benefit of the instructor’s nettlesome questioning.

Which approach is a better reflection of science (including mathematics) as it actually occurs?  The P1 approach is purely retrospective, whereas P2 is used whenever a new phenomenon must be incorporated into an existing body of knowledge.  Assuming that the primary virtue of a higher mathematics class for a non-math major is to encourage the development of powers of abstract reasoning, is it not better to teach in the mode in which discovery actually takes place?

Of course some facts are important and should be clearly stated.  Future mathematicians in particular need much exposure to the P1 style, and they must be able to handle theorems. But for mathematics classes taught to scientists, it may be just as well to let ontogeny imitate phylogeny from a pedagogical viewpoint.

Posted in Uncategorized | 6 Comments

About the header image – A reprise

Utterly inspired by the header image of the Cairo tessellation (Jonas’s 2/4 post), I’ve been slightly obsessed by street tiling these days. On a recent Friday when the weather was simply gorgeous, I, along with my dog, Basil, decided to go tile-hunting in our neighborhood. None seemed to have “notable mathematical properties” (or do they?) as the Cairo tessellation does, but some were very pretty. The winner of the day (for me) was the one in the middle, the tiling you can find in front of the Smithonian Cooper-Hewitt National Design Museum on East 91st Street and 5th Avenue (currently closed for renovation). The yellow-ish colored herringbone pattern was mesmerizing, and I was standing there for a while looking down on the sidewalk.

Three questions: 1) Math indeed seems to be everywhere. Can mathematicians enjoy walking around without being distracted every 5 seconds?; 2) Can “pretty” be expressed in math? How?; and 3) Can you guess where the other two photos are from?

Posted in Uncategorized | 15 Comments

Mathy reads

I once had an undergraduate professor, charmingly bespectacled and pleasantly ill-suited for his chosen career of mathematics, who said that no matter how high one goes in math, he or she would still need from time to time to take in some broad mathematical reading.  His view was that this is necessary to renew our sense of perspective, and to provide a reminder of the inherent worthiness of the discipline.  We were talking, I think, about Simon Singh’s not especially good book Fermat’s Last Theorem, which had just come out.  Having spent the last decade and more around mathematicians, I doubt that what he said is exactly true.

But his apothegm applied accurately to himself, and it applies to me as well, and possibly others, and so I thought I would share a couple of books that I’ve found particularly motivational, and which could also have pedagogical uses.

The first is the amazing Princeton Companion to Mathematics, edited by Timothy Gowers.  This thousand page tome is a desert island book (for me at least), and should be buried on the moon in case of a terrestrial calamity.  It summarizes, in terms that everyone with a BA in mathematics can understand, approximately the whole mathematical firmament as it currently exists.  The quality of the articles, each written by preeminent scholar in the relevant field, makes Wikipedia look like dross by comparison.  It includes a summary (but highly insightful) treatment of every major branch of mathematics. The authors generally have a gift for exposition, and provide a visceral sense of the real significance and excitement of their areas – a feeling that would otherwise be impossible to experience without serious commitment.   There is a listing of individual theorems and conjectures of importance, and several hundred brief biographies.  There are philosophical discussions about the nature of mathematics, and a fair amount of general mathematical history.  To read the whole volume would be an incredible education.  At about $35 for a used copy, the value is impressive as well.  It’s true that the corresponding information on the internet is free, but the quality of that material is many times lower than that of the essays in this printed book (also available in ebook.)


A work which is similarly broad but challenging by non-mathematical standards is a 2 volume series called Musimathics by Gareth Loy.  Like the above book, this is something I have only nosed through – reading it will take a casual reader approximately a year, I would think.  It begins with what you might expect – a mathematical treatment of tones and scales, which, though well done, is the least interesting part of the book.  What really makes this book special is the combination of historicity, mathematical exactness, and a complete lack of prerequisites.  All of the mathematics needed to understand the concepts is cogently and briefly introduced and then immediately applied to a concrete problem in music.  I have never seen anything more digestible and equivalently sophisticated except maybe Frank Shu’s The Physical Universe, to which much of my praise for this book also applies.

It is daunting to try to characterize what a devoted reader of Loy’s book would learn, because the answer seems to be everything.  It puts me in mind of a maxim I absorbed from another undergraduate professor:  If you really want to understand philosophy, try to deeply understand just one thinker.  The implication is that you would then understand everything else through some kind of reflection of the universal in the particular (not coincidentally this was in a class on Hegel.)  To understand one thing is to understand its connection to everything else, which is in fact to have total understanding.

Let me give a few samples from Loy’s work:

“Algorithm is the most highly qualified methodology.  The word comes from algorism, which means to calculate with Arabic numerals (footnote leading to a brief biography of al-Khorezmi).  According to Donald Knuth (1973) algorithm is a broader concept, covering any set of rules or sequence of operations for accomplishing a task or solving a problem so long as it demonstrates each of the following five characteristics:  [discussion of the nature of an algorithm]”

Then later:

“The crucial characteristic of useful random processes is that chance events must be independent of each other.  By independent I mean that even knowing a very large set of outcomes does not help us guess any other outcomes.  If the outcomes of a random process are absolutely independent, then…[discussion of elementary probability]”

And later still:

“How many seven-note scales are there in the 12 pitches of the dodecaphonic system? This is like taking N unordered objects R at a time.  It seems reasonable to expect that there will be fewer scales of seven pitches than melodies of seven pitches because melodies can repeat a note, whereas scales cannot.  We must divide the pitches into two groups…”

What?  This is a book about music (of which there is plenty), but suddenly we are learning concepts from computer science, number theory, wave mechanics, and seemingly everything else under the sun.  Here is a (non-comprehensive) summary of the mathematical concepts a student would learn by reading the first volume:  Cardinality, basic set theory, combinatorics, wave mechanics, trigonometry, probability distributions,  fractal geometry, Brownian motion, filtering a signal, Euclid’s algorithm, Markov chains, Graph theory, higher order Markov processes, formal grammars,  artificial neural networks (including back propagation), genetic programming,…

And this barely scratches the surface in the first volume.  Note well that while these topics are presented in an accessible way, all of them are used for something practical, and none of them are treated trivially.

This is not mentioning the various subjects in the humanities covered, such as the nature of learning, time, aesthetics, atonal music, elements of musical and mathematical history, connectionism, calculating beauty, and many more.

I think this quote nicely summarizes the philosophy the book presents:

“Comparing Euclid’s method with Guido’s method, we saw that they are distinguished only by the role of subjective choice—of nondeterminism—in art.  Art is not science, but their methods are more alike than different.”

Loy’s book would make an excellent reference in a liberal arts themed mathematics course.

Posted in Uncategorized | 4 Comments