A professional mathematician has, through exposure to many trials, become something like a desert creature, capable of supplying “meaning” metabolically by an internal gland rather than imbibing it from without. It can be difficult to diagnose “meaning deprivation” in our more delicate students, who can begin to wilt in what we perceive to be a perfectly cool and saturated environment.

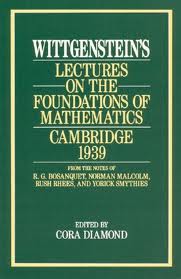
In this post I want to experiment with what I think is a helpful beginning in a characterization of meaning for the purposes of mathematical pedagogy. The definition in question is that “The meaning of a proposition is the means of its verification,” and it occurs in Wittgenstein’s Lectures on the Foundations of Mathematics.
It seems that anything W says captures only clumsily his actual view. I take the above slogan only as a starting point for a discussion. The views of Wittgenstein relevant to this post are explained better and at greater length in this summary of the Philosophical Investigations.
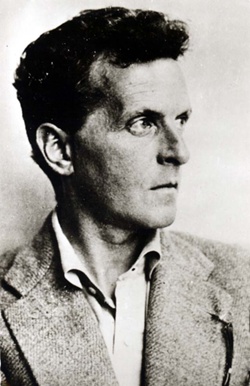
The Lectures on the Foundations of Mathematics (LFM) was transcribed from classroom discussions that occurred in Wittgenstein’s later period (c. 1939), during his “second coming” at Cambridge. (In the early lectures, Alan Turing appears as a participant.) In this period, the philosopher was elucidating his ideas on language games and forms of life. A recurring theme in this line of thought is that the meaning of any word (or phrase) is best understood by careful examination of the way in which the word is used. To recruit another slogan: meaning is use.
A corollary of this view is that “essentialist” descriptions of activities and words can lead to confusion if taken too seriously. The notion of a “game” encompasses many different types of activities: soccer, chess, fencing, horseback riding, etc. For any formal definition of what a game should be, it seems possible to find an instance that either shouldn’t be included in the extension of the definition, or else should be included, but isn’t. Any dictionary definition is fairly easy to “break;” because of the attention W called to this issue, people have gone to great lengths to perfectly specify what is meant by game. The conclusion we are intended to draw is that the things we call games bear a “family resemblance” to one another, but are not all skewered by any expressible criteria (to a mathematician, this brings to mind the notion of an ultrafilter). What the word “game” means is not something that can be cashed out in terms of other English words–it is part of our common form of life that we understand the role of the word game in discourse.
Wittgenstein adheres to his anti-essentialist philosophy, emphasizing the role of words in everyday life, even in the context of mathematics. This naturally creates an interesting tension, because, superficially at least, mathematics is teeming with formal definitions, words with “objective” meaning, and essentialist characterizations.
When we are not in a reflective mood (when we are “just working”) we are happy to say that a theorem  is true just if the condition it describes really obtains: All isosceles triangles have two angles the same, etc. In this naive mode, which is the mode in which we teach, the meaning of comes from the fact that it describes an objective state of affairs. We need to contrast this with the “meaning is use” view. In the “meaning is use” mode, I will try to cash out the meaning of a proposition:
The assertion that my keyboard is 24 inches wide means that I can find other objects, such as measuring tapes, that others also believe are 24 inches, and put them against my keyboard in such a way that myself and others will be satisfied that my claim is true. In contrast to this view of the meaning of the phrase “my keyboard is 24 inches wide,” there is the more metaphysical and more absolute understanding that in some sense my keyboard really is 24 inches, and that my utterance merely calls attention (correctly) to that state of affairs. From the first point of view, the meaning of the length of my keyboard has a normative component, and arises in a complex way from the role of length, and other notions, in my form of life. From the second point of view, the length of my keyboard is an empirical question, and empirical data alone determines the truth value of the claim. This way of viewing questions of length might be characterized as being positivist.

To give a more abstract example of “meaning as use”, and an application to mathematics, consider the following statements.

-


In some sense these claims are all of the same form, namely that of a cardinality claim. But they are all of an extremely different character from one another. I will summarize for each (except the last one!) a corresponding method of verification.
- This is “immediately clear.”
- We count the members of the set one by one until we utter (perhaps silently) the word “ten.”
- By definition of
 — this is a tautology.
- We construct an abstract map (there are many issues buried here).
- This statement has no known method of verification.
The above indicates that each of the cardinality claims has a different subjective import from the others, but we want to say that there is more involved than a difference of accompanying sensation. The first two claims have “naive” or “empirical” meanings which feel to be in rough agreement with the meaning that derives from their role in language games. In particular the symbols “two” and “ten” are given more or less their ordinary meaning.
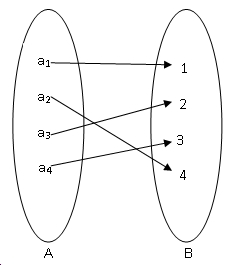
For the latter three statements, this correspondence seems to come apart. There is on the one hand the “naive” understanding that there are two sets that stand in the stated relation to one another. But now (in the previous sentence) my use of the words “are”, “sets” and “stand” have taken on nonstandard (specialized) meanings. They are part of a very different language game. Verifying that there are even integers is a different sort of practice than counting out five apples. Some of the ordinary sense of cardinality is preserved in the new game, and some of the sense has changed. It is not the same “cardinality game” as in the finite case, though it bears a clear resemblance. With a certain amount of technical training, which emphasizes the use of a “one-to-one” correspondence, these cardinality games can be seen as “the same.” When we believe that they really are the same, however, W would argue that we have been bewitched by language.

This is an interesting topic and one could go on much further, but to come back to pedagogy: It can arise naturally in a mathematics class that a superficial similarity, perhaps of notation, conceals a deep difference. One can see this in very basic examples such as  and
and 
We might produce either of these “off the cuff” as a generic example of a quadratic equation, but the physical act of finding a solution to one or the other is unique in each case. Naturally there is a sense in which they are the same (both are solved by the quadratic formula) but
- we would not consider a student educated who could not articulate the important differences between the two equations
- one cannot see the sameness of the two equations without training

History illustrates the second point well: Al-Khwarizmi gives six types of quadratic equation rather than the modern general form of  . Expressed in post-cartesian notation, with coefficients assumed to be positive, Al-Khwarizmi’s equations are:
- Squares are equal to roots (
 )
)
- Squares are equal to numbers (
 )
)
- Roots are equal to numbers (
 )
)
- Squares and roots are equal to numbers (
 )
)
- Squares and numbers are equal to roots (
 )
)
- Roots and numbers are equal to squares (
 )
)
Where we (after intense training) see one type of equation, Al-Khwarizmi sees six.
Note that the equation  is not given a category, because its solutions are imaginary.
This is a recurring difficulty in pedagogy: From a certain point of view, two things are “the same.” But the meaning of sameness is the technical mathematical notion of equivalence, not the everyday idea of similarity. The meaning of sameness must be illustrated by its use. Seeing things as the same is an achievement that comes from mastery of a certain kind of language. This is a form of language which we are constantly illustrating to our students (while perhaps consciously teaching them something entirely different).

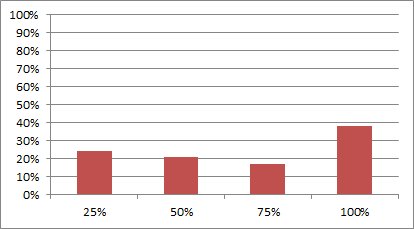
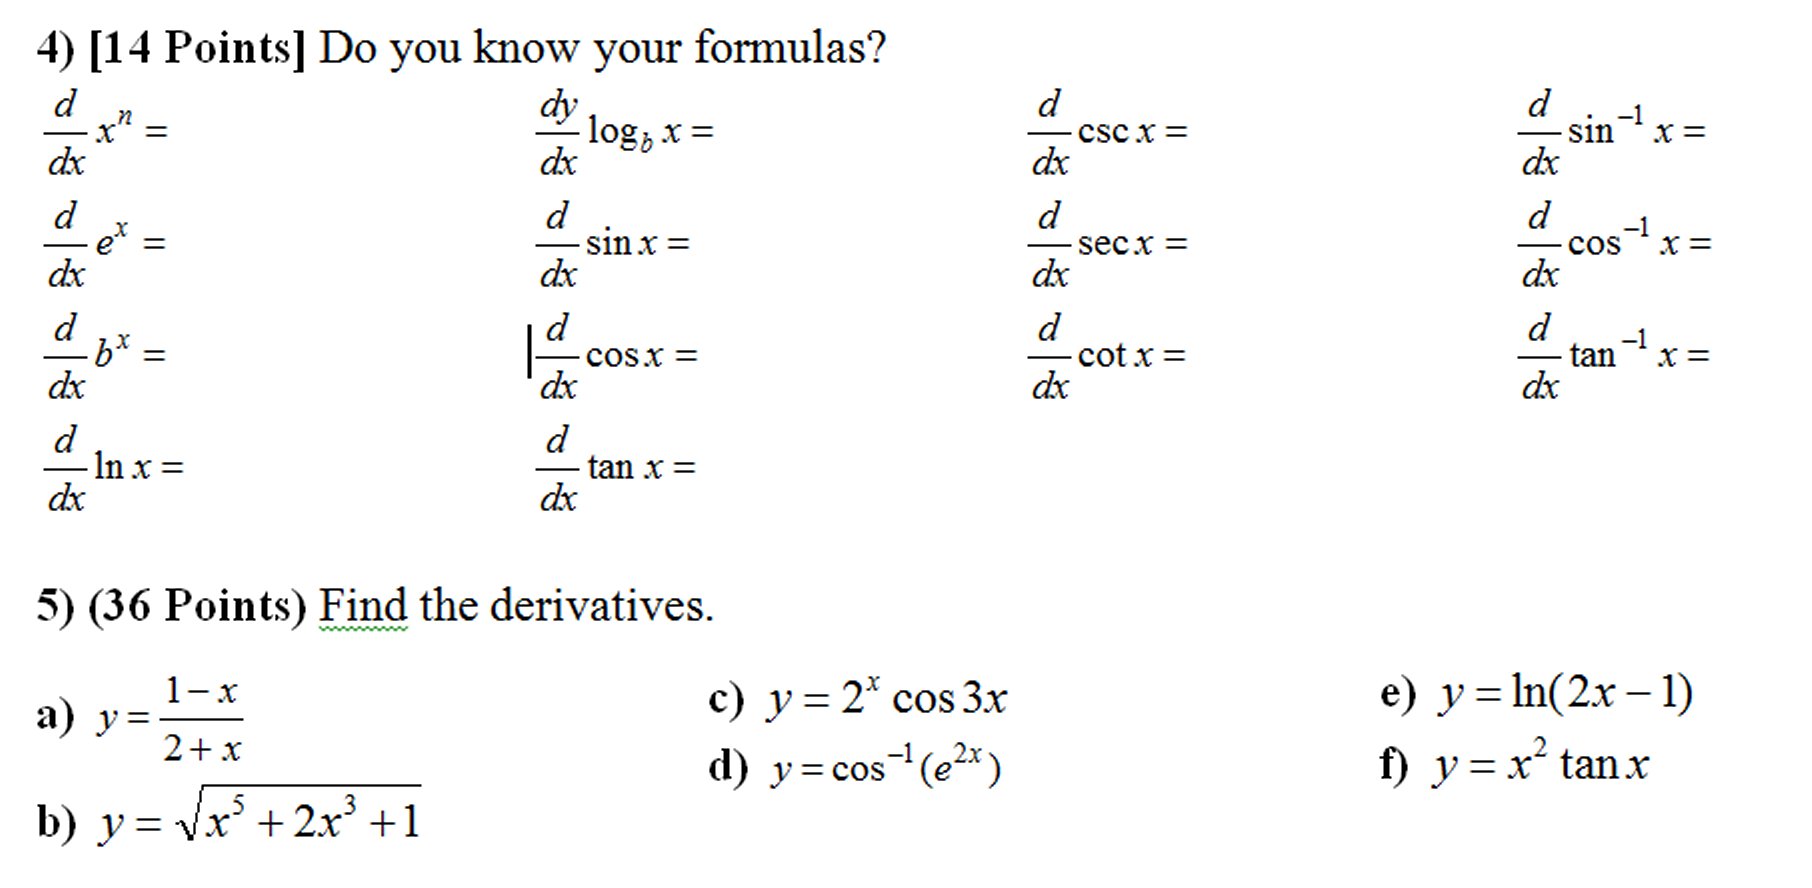
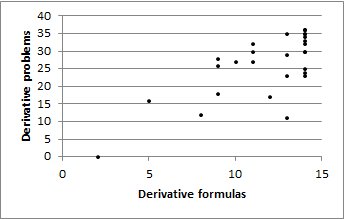
Consider the difficulty of teaching students the meaning (or use) of a formula. I have in the past been surprised that in calculus many students do not understand the meaning of an equation with several terms, such as

They see the rule (if they are trained to perceive the statement as a rule) but they do not know its use. I find it very challenging to see this difficulty from the students’ point of view. What doesn’t make sense? Why are they not satisfied that they understand, if they see the symbols, grasp the corresponding meanings, understand arithmetic and the notion of equality? What is left to know?
It is easy to brush off these questions–students will get used to the equation. Indeed they will. But what changes? Is their confidence in their own understanding of the concept slowly increased simply by long exposure?
I think this is a situation where Wittgenstein’s theory of meaning can play a useful role. What the students are missing, in my view, is exactly the use of the formula in our mathematical form of life (from which the meaning of the formula derives). How is the formula used? It is used to solve problems about gravitational attraction between two masses. And what does this consist in? Well, suppose there are two particles and you know that masses of both, but not the force between them, then…
The use of the formula is to play a certain kind of computational game called “algebra”, with which we are deeply familiar. Even if the student knows the algebra game, she will not “understand” the new formula until the symbols in the formula are connected with algebra–connected with what the formula “actually does”.
I have had very good professors in my life who have actually said to the class: “Why do you not understand? It is only addition, subtraction, multiplication and division!”
And they were right in a way. It is very puzzling that students understand arithmetic, but do not understand easily something like a rational function. Wittgenstein points to a solution to this paradox which I find insightful: When we (mathematicians) see a rule expressed as an equation, we not only see the rule, but, through our training, know its use. This knowledge of use (or its absence) in mathematics is what confused students rightly intuit that they are missing.
Wittgenstein is very sensitive to the problem of learning to use a rule. Here is an extended excerpt from LFM:
(Wittgenstein speaking)
Suppose that I write down a row of numbers

and say, “What series is this?” Lewy suddenly answers, “Now I know!”–It came to him in a flash what series it is.
Now what happened when he suddenly understood what series it was? Well, all sorts of things might have happened. For instance, the formula  might have come into his mind–or he might have pictured the next number. Or he might have said, “Now I know!” and gone on correctly.
But suppose that the formula had struck him. Does that guarantee that he will go on and continue the series in the right way? Well, in an overwhelming number of cases, yes; he will go on correctly. But now suppose that he goes on all right until 100, and then he writes “20,000″. I should say, “But that is not right. Look, you have not done to 100 the same as you did to 99 and all the previous numbers.” But suppose he stuck to it and said that he had done the same thing with 100 as he had done with 99.
Now what is doing the same with 100?–One might put the point I want to make here by saying, “99 is different from 100 in any case; so how can we tell whether something we do to 99 is the same as something we do with 100?”
…
Yet suppose I say, “You don’t know what it is to do the same to 100 as 99. Well, I’ll show you. This is the same as this.” But he might reply, “Very well, but how am I to apply that definition to this case?”
This passage illustrates that the problem of teaching a rule is bound up in the teaching of the use of the rule. It seems to me that use is often precisely what is missing in a student’s understanding in many practical situations. In the past I have been trying to prove a limit ") to the class and have given evidence with a graph of the function
to the class and have given evidence with a graph of the function ") that the limit is such and such. But frequently this explanation is met with the silence of incomprehension. Obviously the students have not connected the graph of a function with its use. Perhaps they have not even connected the idea of a limit with its use.
that the limit is such and such. But frequently this explanation is met with the silence of incomprehension. Obviously the students have not connected the graph of a function with its use. Perhaps they have not even connected the idea of a limit with its use.
To come back to the argument begun above, to understand the statement =a") it is necessary to understand how the statement is verified, be it with a graph or a calculation. The formal definition of a limit is of no use to a student who is unable to ground any of the terms used in the definition, and who moreover has no experience in the *use* of the definition.
it is necessary to understand how the statement is verified, be it with a graph or a calculation. The formal definition of a limit is of no use to a student who is unable to ground any of the terms used in the definition, and who moreover has no experience in the *use* of the definition.
Let us consider what implications a Wittgensteinian mathematical philosophy should have for the teaching of mathematics. If we agree with Wittgenstein about meaning as use, the problematics of learning a rule and (something not discussed here) the nature of essential properties, is there a practical way in which pedagogy should change? We will ignore issues of whether W himself would view the content of certain mathematics classes as subject to criticism (as he might if the material uncritically employed some aspects of set theory).
An individual committed to the above view of meaning in mathematics sees the teaching of mathematics in any fashion, even the most formalist, as the teaching of a form of language. The instructor initiates his or her students into a form of life, and a collection of language games, through some process that we will not attempt to explain, but which certainly involves many demonstrations of the use of technical words and concepts. (Though we consider the details of the “acculturation” question as beyond the scope of this essay, it is concerned with Wittgenstein’s notion of training, about which much has been written.)
Since “training” is what occurs in math instruction in any case, it is not necessarily helpful to try to do it deliberately. Any teaching style acculturates the students into ways of doing mathematics, and by facilitating the absorption of these norms, the work of the teacher is done. This is true if the class is taught in the style of Lakatos or in the laconic tradition of Bourbaki.
But perhaps there is room for a few fine points. I think one consequence of Wittgenstein’s view is an appreciation of the great deal of time needed to understand mathematics. One can be convinced (wrongly) that he or she is teaching only rules and facts, and that learning facts and rules is easy; facts and rules are comprehended and left behind in short order. But Wittgenstein shows us the same process through the lens of language learning. We all know that absorbing a language is hard, time consuming, and fraught with a thousand exceptions, idioms and complexities. To learn a language one has to be immersed in it for a long period of time.
If one views mathematics as a language, or even as a culture, or a form of life, then it is clear that very little can be absorbed in a single semester course. The students in these courses are likely to be bewildered by an onslaught of meaningless symbols and techniques, for which they never learn to associate any use or value.
The necessity for immersion indicated by W’s mathematical theory is one I think we can make some use of at our university. At CUNY students are frequently challenged in their educational efforts exactly where the issue of immersion is concerned. Namely, many of our students commute long distances, are unacculturated to mathematics previous to matriculating, and frequently have extra-curricular responsibilities that restrict the time available for academic work.
Beyond immersion, the metaphor of mathematics learning as language learning suggests that a family of techniques found to be useful in the teaching of language may benefit mathematics students as well. Some things that come to mind are the following:
- Long interactive days of mathematics instruction
- Friendly departments, which can serve as hubs for the dissemination of mathematical culture
- Engagement with those who are already fluent : mathematics clubs, tutoring, and recitation sections
Exposure in early childhood is another possibly fruitful linkage, but not one that we can make use of at the post-secondary level.
Of course all of these practices are already in place at the best departments and the most math friendly schools. Perhaps, on campuses where some of the above could be done better, we should make efforts to do so.

/38 \approx -0.92") , which is very impressive.
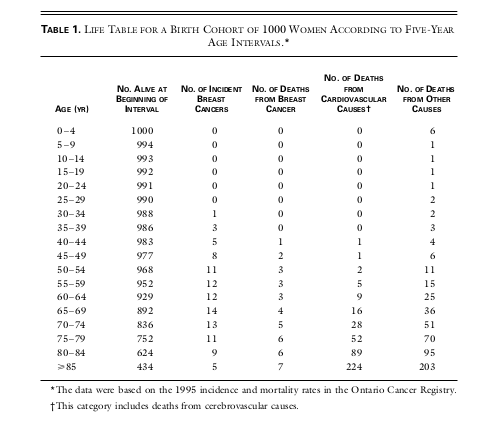
, which is very impressive. breast cancer incidences among 214 women, which also means that
  women had no benefit from mastectomy. For some medical professionals, they prefer expressing clinical implications of the findings in terms of “number needed to treat.” In this case, the number of patients who would need to be treated to prevent a bad outcome is then
  . It has been shown that results expressed as the relative risk reduction and those expressed as the number needed to treat have different influences on decisions about treatment.