On Creativity (in mathematics).

This post is in collaboration with Prof. Vrunda Prabhu from BCC who discovered Koestler’s Act of Creation for the teaching of mathematics.

One of the central problems to be solved by us in the courses of algebra is the absence of interest of students in mathematics itself. “Mathematics is not cool” one often hears from students, from the community and sometimes, from colleagues of faculty. The reasons, as evidenced by students essays describing their attitudes to mathematics are, generally, earlier exposure to it, the sense of failure and “cannot do” attitude. Students are often aware of their situation and despair about their inability to break those habits. Mathematical creativity maybe one of the tools (if not the only one) we, the mathematics instructors have to reverse the trend of failure and “cannot do” attitude and transform it into enjoyment of the subject, and successful mastery of the concepts under consideration.

 That raises the question, what is mathematical creativity and how to facilitate it in the course of elementary algebra or arithmetic.

The Act of Creation of Koestler (1964) formulates it by defining “bisociation” that is “the creative leap [of insight], which connects previously unconnected  frames of reference and makes us experience reality on several planes at once.” Consequently, the creative leap of insight or bisociation can take place only if we are considering at least two different frames of reference, within a discourse. Note the similarity of Koestler’s definition of bisociation to Einstein’s description in “What is Thinking?” in the previous post: “…When, however, a certain picture turns up in many of such series, the precisely through such a return, it becomes an ordering element for such series, in that it connects series which by themselves are unconnected, such an element becomes an instrument, a concept.

The similarity suggests that mathematical creativity is closely related to understanding. In fact, Koestler ”…distinguish[es] between progress in understanding – the acquisition of new insights, and the exercise of understanding at any given stage of development. Progress in understanding is achieved by the formulation of new codes through the modification and integration of existing codes by methods of empirical induction, abstraction and discrimination, bisociation. The exercise or application of understanding – the explanation of particular events – then becomes an act of subsuming the particular event under the codes formed by past experience. To say that we have understood a phenomenon means that we have recognized one or more of its relevant relational features as particular instances of more general or familiar relations, which have been previously abstracted and encoded”.

 How to facilitate that process?  Koestler offers a suggestion in the form of a triptych, which consists of “three panels…indicating three domains of creativity which shade into each other without sharp boundaries: Humor, Discovery and Art.” Each such row of a triptych stands for a pattern of creative activity which is represented on them; for instance:

     Comic comparison   <–>  objective analogy  <–> poetic image.

 The first is intended to make us laugh, the second to make us understand, the third to make us marvel. The creative process to be initiated in our classes of developmental and introductory mathematics urgently needs to address the emotional climate of learners, and here is where the first panel of the triptych comes into play, Humor. Having found humor and the bearings of the concept in question, the connections within it have to be explored further to “discover” the concept in detail, and finally to take the discovery to a form that discovery is sublimated to Art.

An example of the triptych assignment used by V. Prabhu in the class of Introductory Statistics consists of students completing the given skeletal triptych below and adding a sentence or two for each completed row to indicate the connections between the words used (the assignment was staggered and repeated several times during the semester):

                Trailblazer  <———->      outlier   <————–> original/ity

                                     <———–>   sampling  <————->                                       

                                  <————->probability <————->                                     

                             <————->  confidence interval <————->                               

                     <————->   Law of Large Numbers  <————->                          

                   Lurker  <————->correlation <————-> causation

            lurking variable


 The triptych below is an example of student work:

                      Trailblazer  <———————>OUTLIER  <—————>  Original

                        Random <———————>SAMPLING  <—————>Gambling

                         Chance<———————> PROBABILITY<————-> Lottery

                Lurking Variable  <—————>CORRELATION <———–>Causation

                         Testing <————->CONFIDENCE INTERVALS  <——>   Results

                  Sample Mean <———> LAW OF LARGE NUMBERS <—–> Probability

 Triptych assignments facilitate student awareness of connections between relevant concepts and thus they facilitate understanding. However, what maybe even more important, the accompanying discussions help to break the “cannot do” habit and transform it into original creativity. Below is the triptych (with a student’s completion) from a  developmental algebra class:


Number<—————>  ratio  <—————->division

Part-whole <———-> fraction <————-> decimal

Particularity <———–>abstraction <——–>generality

<———————> variable <———————>

multiplication<———->  exponent  <———->power

 The triptychs of Prof. Prabhu are being refined and their utility assessed with every new semester cycle of classroom Teaching-Research.

 Use of triptychs in the mathematics class, bring back the puzzle inherent in mathematics.  What is the connection between the stated concepts?  What could be concepts connected to the given concepts?  Given the largely computational nature of the elementary classes, and students’ habit of remembering pieces of formulas from previous exposures to the subject, a forum for meaning making is created in connecting prior knowledge, with synthesized, reasoned exploration.  The question “how”, answered by the computations is augmented with the “why” through the use of mathematical triptychs.

Posted in Uncategorized | 10 Comments

A course I like

I like teaching “math for poets” classes and I have taught many. There are so many fascinating things students don’t know about. Many years ago, at the Fashion Institute of Technology in Manhattan, the textbook I chose for the course was Rudy Rucker’s Mind Tools: The Five Levels of Mathematical Reality. It is a wonderful book. In contrast with the publisher’s description I quoted in my previous blog, this one reads:

From mathematics and computers to insights into the workings of the human mind, Mind Tools is a reflection of the latest intelligence from the frontiers of mathematical thought. Illuminated by more than 100 drawings, Mind Tools connects mathematics to the world around us. It reveals that the great power of mathematics comes from the fact that it serves as an alternative language for understanding things — from one’s hand to the size of infinity. Exploring such concepts as digital versus analog processes, logic as a computing tool, and communication as information transmission, Rudy Rucker presents the “mind tools” for a postmodern age.

I enjoyed teaching the course, and I do not think I taught it badly, but as the semester progressed it became more and more clear that I was the only person in class enjoying it. The text turned out to be too philosophical and too difficult for students to digest. Despite my best efforts, they were confused about homework assignments and course requirements (they did turn in some very nice Escher-like drawings though). The course was a failure, and at the end I had no one to blame for it but myself. I underestimated by far the difficulty level of the content. Certain topics are just too hard, not from the technical point of view, but conceptually. It is tempting to teach about Hilbert’s Hotel, Banach-Tarski miraculous doubling of an orange, or Koch’s snowflakes, but in reality a much more successful course is the one that shows how the mathematics that students already know can be put to interesting uses. One such course is offered regularly at Bronx Community College under the title Survey of Modern Mathematics I. The syllabus is flexible and it allows the instructor to make choices of the material. My strategy for teaching it rests on the principle not to introduce mathematical tools beyond what is required by the prerequisites for the course, and this is not much—just elementary algebra. At the same time I try to use those topics that actually use elementary algebra, to show students how what they’ve learned is applied. I will give a brief outline of the course.

The course starts with a short discussion of ancient numeration systems, and then moves quickly to the positional Hindu-Arabic system. I avoid mechanical conversions from one base to another, instead I concentrate on just one system—quintary—which I call the one hand arithmetic. I explain how to add and multiply in base five, and sometimes we go over subtraction and division as well. The goal is to explain how and why the familiar decimal algorithms work. After initial resistance, students get used to quintary operations. It really helps that one can use hands: 4 means four fingers; 12 is one hand and two fingers; 23 is two hands and three fingers, and so on. At the end I introduce the binary system and we talk about its applications in computer technology.

It is hard to teach even a very scaled down probability course in just three or four weeks. To do it properly, one has to introduce some set theoretic notation, cover basic counting techniques, introduce notions of sample spaces, relative frequencies and much more. It takes time, and it is hard to expect that students will absorb much. Still something can be done. I begin with  the definition of theoretical probability for events with finitely many equally likely outcomes. I show how the relevant numbers can be computed on simple examples, and then we go right away to actually performing experiments with random outcomes and to comparing theoretical predictions with relative frequencies recorded in class or in homework exercises. We toss coins, roll dice, and play games. It is really amazing to see how nature obeys theoretical predictions. I particularly like one game I took from Ian Stewart’s Concepts of Modern Mathematics. Four dice A, B, C, D are labeled with numbers in such a way that when a pair of dice is rolled one shows a higher number with probability 2/3, moreover the number are chosen so that B beats A, C beats B, D beats C, but A beats D. It is a two person game. The first player chooses a die, the second another die, and then they roll. It is a very unfair game, if the second player knows the probabilities, he or she has enormous advantage, and that player in class is me. Sometimes we spend the whole class period playing the game and recording statistics. Students get very intrigued, and much can be explained. Among other things, we discuss odds of winning the grand prize in the Monty Hall game (the one with goats behind closed doors), and, we use the Monte Carlo method to estimate π.

In the third part of the course I cover linear programming. It may not be everyone’s favorite, but I like it. Even though one can talk about small systems of constraints for two unknowns, still some real applications (such as some diet problems) can be discussed. Even more importantly, one can see how some meaningful practical problems can be easily solved with very basic algebra, and almost impossible without. Another aspect is optimization: not only we can find solutions to practical problems, but we can also show that they are the best solutions available.

At the end of the course we turn to financial mathematics: the compound interest formula, annuities, mortgages, and loans. This is a very traditional part of the course. Formulas are introduced, examples given, homework exercises assigned, but once it is done one can turn to very practical issues. How to read credit card statements? How to plan savings? How to respond to a refinancing offer from your mortgage company? No college student should graduate without some exposure to these topics.

Posted in Uncategorized | 1 Comment

Polls, Observational Studies, and the Meaning of “Random”

Last week, Chancellor Goldstein posted a very interesting piece related to the Central Limit Theorem (CLT).  I think experienced statistics instructors will concur that few students truly grasp the essence of the Theorem.  I myself did not fully appreciate the CLT when I was an undergraduate student.  For the untrained mind, the term “random variable” tends to elicit a negative emotional reaction, because colloquially “random” is synonymous to “chaotic” or “arbitrary,” which is undesirable.  The beauty of the Central Limit Theorem is that it tells how random numbers should behave.  Random numbers are not just some crazy numbers, but they must follow equations described in the Chancellor’s blog.  When introducing random variables, I enjoy telling this story about the Nobel laureate Murray Gell-Mann.  In the 1950’s, while being a Caltech professor, Gell-Mann also served as a consultant at the RAND Corporation, a military think tank.  One day, he received the book “RAND Table of Random Numbers,” and to his amusement he found an errata sheet in it.  The RAND mathematicians needed to supply “corrections” to some of the random numbers!

The Central Limit Theorem is so named because of its central importance to probability theory; inferential statistics work because we know, on the basis of the CLT, how to quantify random variations (again they are not arbitrary).  Now that it’s the election season, we are bombarded with poll numbers and their margins of error.  Polling is one of the most encountered applications of inferential statistics in our daily life, yet I suspect that many people have difficulty connecting their textbook statistical knowledge to news reports.  The problem is that introductory textbooks try to be as general as possible, and statistical concepts are expressed in terms of \hat{p}, z_{\alpha/2}, and all those Greek letters (literally).  For students less comfortable with algebra, the central idea got obscured in the profusion of mathematical symbols.  Because the term margin of error is mentioned so frequently in news media, let me give a quick-and-dirty way to estimate it: it is the reciprocal of the square root of the number of people polled (see the technical note below for justification).  For example, if we read that a New York Times/CBS poll found that the President’s approval rate was 45%, and this poll was based on interviewing 1,009 likely voters, then the margin of error is 1/\sqrt{1,009} \approx 0.03 or about 3%.  In the same poll, if we asked a subgroup of 301 Republicans about their opinion, the margin of error would be 1/\sqrt{301} \approx 0.06 or 6%.  You should use your calculator to verify some of the published polls.  Although I know the math, I still find it amazing that the margin of error does not depend on the size of the population, and surveys of the entire US (population 300 million) typically involve samples of only about 1,000 respondents.  You will still need a sample of about 1,000 to conduct a poll in Iceland (population 300 thousand), or India (population 1.2 billion), to achieve a margin of error of 3%.

We all know that bias in sampling can produce unreliable poll results.  However, I want to highlight the fact that even if we have a fair and ideal condition, we might still miss the target.  The above-mentioned method for margin of error (1/\sqrt{n} where n is the sample size) applies to a 95% confidence level—the level adopted by essentially all polling organizations.  This means that we should expect that 5 out of 100 samples, or 1 out of 20 samples, with confidence intervals not containing the true value.  With so many polls generated on any given day,  it is highly likely that some numbers are simply random fluctuation.

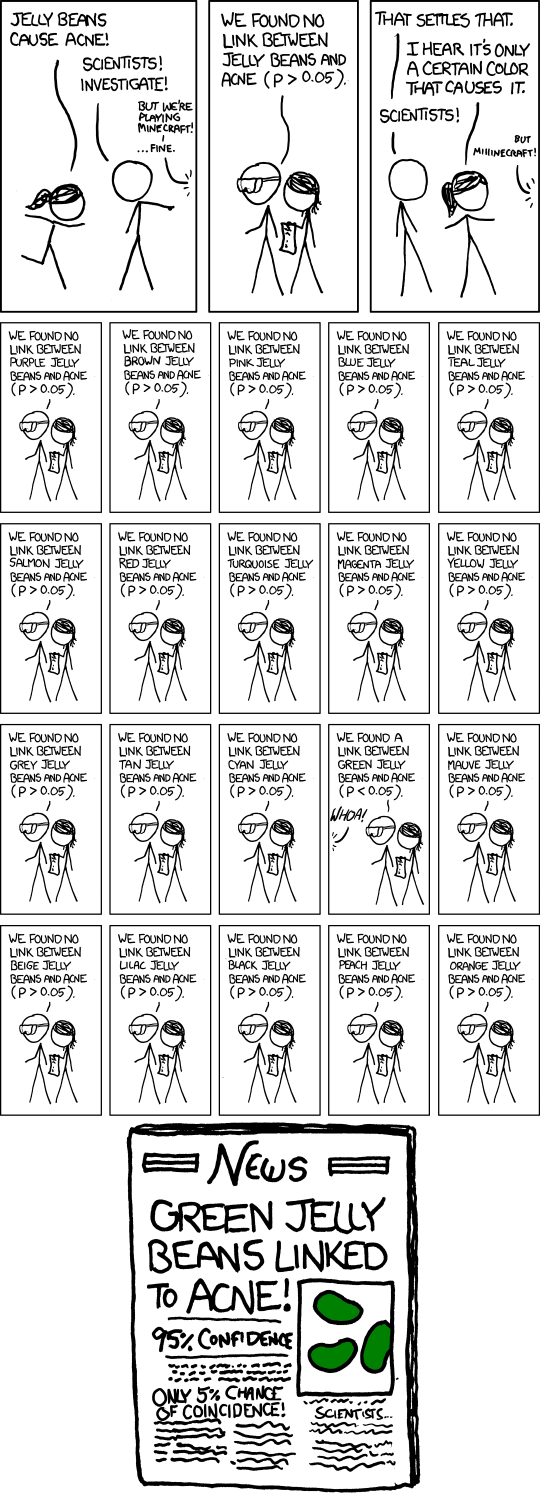
Now I want to switch from estimation to hypothesis testing, which can be viewed as the art of distinguishing pattern from randomness.  (Recall, the CLT predicts the behavior of random numbers.)  We need to recognize that a test of statistical significance does not prove anything conclusively.  It only specifies a p-value, which is quantitative statement of the likelihood that the observed result occurred strictly by randomness alone.  Conventionally, a p-value of 0.05, or 1 in 20, is considered significant, but in modern times, there are many problems with this simple-minded criterion.  The widespread availability of computer software has rendered virtually effortless some statistical procedures that not long ago required days or even months of work.  Of every 100 tests, you expect 5, on average, to be “significant at the 95% level” purely because of random variation.  Therefore, if one tests many hypotheses, some of the hypotheses (1/20 on average) will come up significant purely due to the nature of randomness.  The comic below from xkcd brilliantly explains the basic problem: in this imagined example, there is no overall effect of jelly beans on acne.  But if you try repeatedly with different colors (purple, brown, pink, blue, etc), some colors will eventually reach the significance threshold p<0.05.

This comic illustrates that false positive becomes a near certainty in multiple testing. Source: http://xkcd.com/882/

Nowadays, media are quite eager to sensationalize some seemingly shocking claims.  Undoubtedly you have encountered claims like “coffee causes pancreatic cancer,” “Type A personality causes heart attacks,” “trans-fat is a killer,” and more.  In an article published in the September 2011 issue of Significance magazine, S. Stanley Young and Alan Karr bluntly state that “any claim coming from an observational study is most likely to be wrong.”  They examined the claim “females eating cereals leads to more boy babies” published in the Proceedings of the Royal Society.  The researchers of that study used a food questionnaire not of cereal alone but of 132 different food items.  Young and his collaborators computed 132 \times 2=264 t-tests using the two periods of data supplied by the researchers, and found that the p-values are essentially uniformly distributed between 0 and 1.  To see how small p-values are simply the result of chance, you should try this web animation “there must be something buried in here somewhere.”

When pioneering statisticians developed the standard techniques, they were dealing with far less data using much inferior technology.  I hope readers of this blog become aware of the rampant “scattershot” approach to statistically significant but false discoveries merely due to the property of “random” numbers.

Technical Note.  Consulting a statistics textbook, and you will find the margin of error E at a (1-\alpha) \cdot 100\% level of confidence of an estimated population proportion \hat{p} expressed as
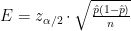
E=z_{\alpha/2} \cdot \sqrt{\frac{\hat{p} (1-\hat{p})}{n}}

where n is the sample size and z_{\alpha/2} can be located in a table.  I think this formula intimidates a lot of students, and most of them will never use it after the final exam.  When talking about the margin of error in polls, because essentially everyone uses a 95% confidence level, z_{\alpha/2}=2.  In today’s politics, the country is roughly evenly divided, and 0.5 is a reasonable value for \hat{p}.  With these assumption, the margin of error becomes much less intimidating: E \approx 1/\sqrt{n}.  Personally, I think no student should exit a statistics (or any quantitative) course without knowing this approximation.

Posted in Uncategorized | Tagged , | 18 Comments

On Understanding (in Mathematics)

The urgent need to rethink the meaning of “understanding” in general, and in particular of “understanding in mathematics” has arisen in the context of specifying the Student Learning Outcomes in remedial and entry college level courses of mathematics. The template of SLO assessment sent out to Mathematics Departments of Community Colleges at CUNY has explicitly removed the phrase “understanding” from SLO’s under a misguided, if not outright incorrect assumption that it can’t be measured, as the grapevine coming to the departments informs. Jon Star of Harvard’s GSE proposes assessment of understanding based on critical thinking and reasoning @http://gseacademic.harvard.edu/~starjo, even in the multiple choice format. But that’s Harvard U, which together with Caltech, MIT and other institutions of similar type are excused from asking for “understanding”. Not CUNY. The time when CUNY was known as the Harvard for the poor seems to be irretrievably lost in the past. That tendency is not, of course limited to our university. A recent conference of all six community colleges of the Hawaii University held in Honolulu last spring had revealed exactly the same top down command of excluding “understanding” from their assessment procedures.

So what is “understanding”?  All of us know it. Any “Aha” moment is the moment of understanding. Since all of us know it, we are to large degree aware that it is a moment when suddenly things start making sense and that means that their relations with each other are very clear.

Wikipedia suggest the following sentence as the “other” meaning  of “understanding”: Understanding is the awareness of connections between individual pieces of information. Cognitive psychology, and in particular developmental cognitive psychology defines understanding of a concept as thinking focused on investigating and utilization of connections between different particular manifestations of the concept in question, that is its schema, the network of relationships.

What kind of thinking is it?

It’s worthwhile to listen to the professional of thinking, A. Einsten, who on the p.7 of his Autobiographical Notes asks a similar question. “What exactly is thinking? When at the reception of sense impressions, a memory picture emerges, this is not yet thinking, and when such pictures form series, each member of which calls for another, this too is not yet thinking. When however, a certain picture turns up in many of such series then – precisely through such a return – it becomes an ordering element for such series, in that it connects series, which in themselves are unconnected, such an element becomes an instrument, a concept.

Piaget, who together with the physicist Garcia of Mexico, investigated the development of  conceptual schema in mathematics and sciences (Piaget and Garcia, 1989) agrees in general outlines with Einstein’s description. The authors point to the fact that essentially there are three levels of schema formation, that is of the process of understanding, the first one is the familiarity with the individual pieces, those “memory pictures” –  the- intra process. The second stage is the reflection and investigation of relationships between the different pieces – the inter level, or that moment in Einstein’s description when “such pictures form series, each member of which calls forth another” indicating that some relationship between individual pieces of information has been established. And finally when the reflection upon the discovered relations blossoms into the grasp of the underlying structure of the developing concept, when “ a certain picture turns up in many of such series then – precisely through such a return – it becomes an ordering element for such series, in that it connects series, which in themselves are unconnected…”, we have              the trans stage of understanding the concept, which transcends the boundaries imposed by its particular manifestations.

All of this is simpler than it sounds. Starting in the early childhood, when the formation of earliest concepts such as a table, a chair, water takes place, exactly the same process of their development as described by Einstein takes place in every child (Skemp, 1977, Vygotsky 1986). First are isolated impressions of different fragments of the chair, then its mutual usefulness and roles, and finally, the chair is grasped as a full, operational concept.

Can this process be measured? Can one ascertain the degree of understanding of a particular concept? Can one measure understanding?

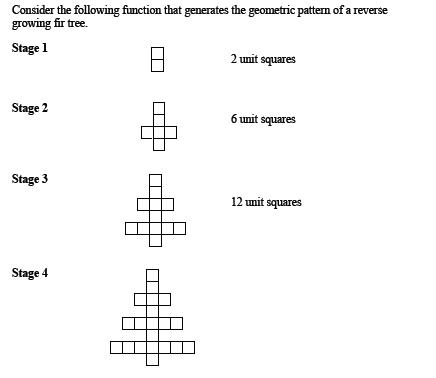
Nothing simpler than that, if one knows what she or he wants to measure, as the performance task preparing DOE/NYC teachers for the introduction of Common Core standards in mathematics shows us:


The  given figures provide first sense impressions and memory pictures as the intra-operational components mentioned by Einstein. Questions 1-3 facilitate the discovery of inter-operational relationships between the memory pictures, so that one picture brings forth another. Question 4 offers the possibility of formulating the concept of the variable which “connects the series which by themselves are unconnected”.  Question 5 can be answered either after successfully constructing the variable general term in question 4, or independently of it through extending understanding of the series, “one member of which calling forth another” for high numbered stages.  Students’ work on the problem and the degree of their success gives precise information as to the degree of understanding the concept of the variable in the context of generalization. The problem was given as an assignment for students in the Math for liberal arts course at Hostos CC. Good 20% of students reached the trans stage of formulating the general term for the series what indicates full understanding of the concept. Around 40% of students reached the inter-operational stage of recognizing the relationship between the series, some reaching mastery of that stage demonstrated by the correct answer to question 5 without using the pathway leading through the general term.

Then what is the problem? Why is really “understanding” in mathematics conspicuously absent from the SLO’s at CUNY’s community colleges and at community colleges around the country by the top down decisions, especially in the light of nation-wide failure in learning algebra as the recent NYTimes article Is Algebra Necessary?  informs? Is it an effect of the “vicious circle” described in the earlier post at https://cunymathblog.commons.gc.cuny.edu/2012/09/09/is-algebra-necessary/, is it an absence of familiarity with the research literature or is it an attempt to undermine the Common Core Standards in Mathematics, for which understanding  is one of the fundamental characteristics?

Posted in Uncategorized | 4 Comments

The Ubiquitous Normal Law

When students are first taught (as undergraduate math majors or as graduate students) about the Central Limit Theorem (CLT), they are often in awe of how all-encompassing this remarkable result is.

They have up to this point been introduced to the concepts of discrete and continuous random variables, distribution functions, independence and conditionality, expectations, convergence in probability and the weak Law of Large Numbers, among other topics.

More often than not they become acquainted with the binomial distribution and apply it to finding probabilities of outcomes associated with coin-tossing experiments. For a large number of trials (which, with today’s powerful math software, would be trivial), the instructor will introduce Stirling’s Theorem, which for our purposes states that

\lim_{n \rightarrow \infty} \frac{n!}{\sqrt{2\pi}e^{-n}n^{n+\frac{1}{2}}}=1

and use it to prove the de Moivre-Laplace approximation to the binomial approximation: If X is a binomial random variable with parameters n and \rho then for positive integer k

P\{X\leq k\} = P\{\frac{X-n\rho}{\sqrt{n\rho(1-\rho)}} \leq \frac{k-n\rho}{\sqrt{n\rho(1-\rho)}}\}

\simeq \frac{1}{\sqrt{2\pi}} \int_{-\infty}^{\frac{k-n\rho}{\sqrt{n\rho(1-\rho)}}}e^{-t^2}\,dt.

What this says is that for large ­n, the number of successes in n binomial trials with constant probability of success \rho can be approximated using a normal distribution.

I have heard students say, “That is really cool,” which of course would please me greatly. But by now the students are ready to be introduced to the CLT. We present the classical version:

Suppose that \{X_i\} is a sequence of independent and identically distributed random variables with finite mean and finite variance. Let Z_n = \sum_{i=1}^n X_i and let E(Z_n) and \sigma^2(Z_n) be the mean and variance respectively of Z_n, then with Z^*_n = \frac{Z_n-E(Z_n)}{\sigma(Z_n)}

\lim_{n \rightarrow \infty} P\{Z^*_n \leq a\} = \int_{-\infty}^a \frac{1}{\sqrt{2\pi}} e^{\frac{-\mu^2}{2}}\, d\mu

for any real a.

That is, Z^*_n converges in distribution to a normal random variable with mean 0 and variance 1, often designated simply as N(0,1).

The instructor states that the CLT greatly generalizes the de Moivre-Laplace results in that it too serves as an approximation to binomial distribution using the normal law but does the same for any number of other distributions as long as its conditions are satisfied. In fact, social scientists and other researchers analyze their data using the normal law as the vehicle for estimation and for testing hypotheses. (Unfortunately, it is somewhat cavalier to approach such problems by invoking the normal law as if it is a universal truth. But of course, that is another story.)

Unfortunately in most courses, at least at the elementary or intermediate level, the story ends here, when it should not. The very brief formulation described above is de rigueur of most content experienced in an introductory probability course. In fact, the normal law is deeply connected to “sums of independent quantities.” And very early work connected to stochastically independent functions, which generalizes sums of independent quantities, frees us in our thinking from the constraints of games of chance, for example.

Nowhere is this more elegantly discussed for the non-expert than in a wonderful autobiography by Mark Kac entitled Enigmas of Chance, part of the Sloan Foundation series by or of prominent scientists. In Enigmas of Chance, Kac gives two examples which illustrate this point vividly and accessibly.

I will only briefly sketch Kac’s first example, which will amply make the point. For the more curious reader, please refer to Enigmas of Chance as a beginning.

To start, recall that for every 0 \leq t \leq 1 there is a unique non-terminating decimal expansion. For example,

\frac{2}{7} = 0.285714285714 \ldots or

= \frac{2}{10}+\frac{8}{10^2}+\frac{5}{10^3}+\frac{7}{10^4}+\cdots

Or in general for any 0 \leq t \leq 1 there exists a unique sequence d_1,d_2,d_3,\ldots of digits (where for any i, d_i can only assume 0,1,2,\ldots,9.) Thus

t = \frac{d_1}{10}+\frac{d_2}{10^2}+\frac{d_3}{10^3}+\cdots

Of course there is nothing sacred about base 10; we can, for example, use base 2. In this case the b_i’s from above can only assume the values 0 or 1, in which case

\frac{2}{7} = \frac{0}{2}+\frac{1}{2^2}+\frac{0}{2^3}+\frac{0}{2^4}+\frac{1}{2^5}+\frac{0}{2^6}+\cdots

so that b_1=0, b_2 = 1, b_3=0, b_4 = 0, b_5 = 1, etc.

Consider now those numbers for which b_1(t) = 1, b_2(t)=0, b_3(t)=1.

The smallest such t is therefore \frac{1}{2}+\frac{0}{2^2}+\frac{1}{2^3} = \frac{5}{8} and, recalling the sum of a geometric series, the largest is \frac{5}{8}+\frac{1}{2^4}+\frac{1}{2^5}+\frac{1}{2^6} +\cdots = \frac{6}{8}

so b_1(t) = 1, b_2(t)=0, and b_3(t)=1 form the interval (\frac{5}{8},\frac{6}{8}) which has length L = \frac{1}{8}.

Denote this as L\{b_1(t) = 1, b_2(t)=0, b_3(t)=1\} = \frac{1}{8}.

Now we can readily see that b_2(t) = 0 can occur two ways:

\frac{0}{2}+\frac{0}{2^2} or \frac{1}{2}+\frac{0}{2^2}.

Reasoning as above for each respective possibility, we obtain two intervals (0,\frac{1}{4}) and (\frac{1}{2},\frac{3}{4}). By summing these lengths we arrive at L(b_1=0)=\frac{1}{2}.

Similarly, reasoning yields L(b_1=1) = \frac{1}{2} and L(b_3=1) = \frac{1}{2}.

Thus L(b_1=1,b_2=0,b_3=1) = \frac{1}{8} = L(b_1=1)\cdot L(b_2=0) \cdot L(b_3=1) = \frac{1}{2}\cdot\frac{1}{2}\cdot\frac{1}{2}=\frac{1}{8}.

And so the reasoning continues, which shows that with the binary variable x replaced by b and P\{\} replaced by L\{\} it follows that with B_n(t) = \frac{\sum_1^n b_i(t)-n/2}{\sqrt{n/4}} that for any a,b

\lim_{n \rightarrow \infty} L\{a<B_n(t)<b\} = \int_a^b \frac{1}{\sqrt{2\pi}}e^{\frac{1}{2}x^2}\, dx.

Notice what has been achieved: by the simple arithmetic demonstration that \{b_i\} are indeed independent in the sense that L\{b_i=j: i=1,\ldots,n, j = 0,1\}=L(b_1)\times L(b_2) \times \cdots \times L(b_n) we simply can apply the CLT to demonstrate convergence to N(0,1) without invoking games of chance like coin tossing or underlying probability distributions assumed for random variables. The normal law can apply as well under conditions that have nothing to do with what the student has thus far encountered in a standard course in probability but, as Kac illustrates, “could be part of everyday mathematics.”

As Kac points out, this kind of thinking was introduced by Hugo Steinhaus in a 1923 paper dealing with arithmetization of probability theory and resulted in bringing the “normal law closer to the mainstream of mathematics”—a useful and important piece in the history of mathematics but a worthy subject in showing how ubiquitous the normal law is.

Posted in Uncategorized | 7 Comments

Is Algebra Necessary?

Algebra is a problem; in schools, in colleges, in the society. One of the most recent proposals to solve that problem by eliminating elementary algebra from the school curriculum altogether came from our colleague, Andrew Hacker, a retired political scientist from the Queens College (NYT July 28,2012). Is algebra necessary? – he asks. The underlying implicit questions are: What algebra? For whom?

In order to answer these fundamental questions it’s worthwhile to ask why our students fail algebra in troves. The study led by Prof Akst from BMCC in 2005 (Geoffrey Akst, David Crook, Virginia Moreno, Cheryl Littman, and Angela Grima, Performance in selected mathematics courses at the City University of New York: Implications for retention. CUNY February 2006)., also a retiree at present, had shown that only around 37% of our students who take remedial arithmetic at CUNY manage to pass the subsequent course of elementary algebra.

It turns out that the problem doesn’t start in the 9th grade as Hacker suggests. It starts much earlier, in the 3rd grade, because one of the central obstacles student encounter in mastering algebra is fractions of arithmetic. And that difficulty stays with them into algebra and later into college math. An excellent study PROM/SE of 2006 (http://promse.msu.edu/research_results/PROMSE_research_report.asp) conducted by the Michigan State University investigating the ability of students in grades 3 through 12 to understand and to master fractions reveals that the lowest percentage of passing students was seen in the 3rd grade, only 24% passing; only 56% in the 6th grade and 73% in the 8th grade passing the PROM/SE exam used in the study.

Following the logic of our colleague, we should abandon teaching of fractions because students have serious problems with them, which persist into college. In fact, recent reorganization of CUNY remedial programs moves exactly in this direction by eliminating arithmetic exam from the exit from remediation. Then why don’t we abandon teaching of fractions? Because fractions, together with ratios and proportions underlie the proportional reasoning – the basic component of mathematical thinking. They are necessary not just for engineering and scientific work but also for our nurses, whose major mathematical job is to be able to do many unit conversions at once for application of different medicines. Thus the logic of our colleague would directly impact the well-being of citizens, in particular of retirees who have to extensively rely on the expertise of nurses.

Why do fractions constitute such a stumbling block for young students? Because fractions represent the first conscious effort at abstract mathematical thinking. They can’t be taught by mere memorization of rules or algorithms but involve the process of understanding mathematical concepts.   In fact proportional reasoning involving fractions in the fundamental way is recognized as the gateway to algebra and that brings us to the stated questions (Berk et al, 2009; Lo and Watanabe, 1997).

The major part of algebra involves the process of generalization of arithmetic and the experience of CUNY instructors of remedial algebra and high school teachers of mathematics indicates that one of the reasons of our students’ failing algebraic exams is, indeed, their weakness in arithmetic numerical skills. It is this weakness in numerical skills that doesn’t allow students to develop a clear notion of variable as generalization of a number.

Now, that we understand a bit better sources and reasons for the difficulties in algebra, we have two options:

One can either eliminate algebra or eliminate the difficulties with algebra.

Andrew Hacker chooses the first option and provides a series of arguments in its support. However, he doesn’t mention the possibility of the second option of eliminating difficulties—the possibility embraced by the new Common Core Standards in mathematics, which aim precisely at eliminating those difficulties in algebra, among others.

I think Hacker and I would both agree that the primary purpose of public education is to give every young person the intellectual tools he or she may need in order to productively develop and follow his or her talents and inclinations.  Hacker argues that algebra (as opposed, say, to arithmetic or quantitative reasoning) is not an intellectual tool necessary for a person’s productive development; in addition, when it is included in the required curriculum, it proves instead (because of its difficulty) to be an obstacle to such development.

The way algebra is generally taught in the US seems to be conceived as a collection of rote recipes (“algorithms”, in Hacker’s terms) for manipulating mathematical expressions consisting of letters and arithmetic operations, and for translating various types of artificial “word problems” into such expressions.  If this is what is meant by “algebra”, then I think Hacker is right: there is no reason on earth why students should be required to undergo instruction in “algebra”.

However, if  algebra is conceived as the general science of quantitative relationships, the concepts underlying such relationships and the tools that have been developed for utilizing them, then algebra so conceived is an inseparable component of modern “quantitative reasoning” – for example, of an actual understanding of arithmetic or of the ability to understand, and critically reason about, statistical relationships (how can you understand a statistical graph without having the concept of a function? or of a Gaussian distribution whose simplest representation is the composition of the exponential function with the “dreaded” quadratic function).  In fact, I would thus argue that algebra conceived is not naturally separable from any serious conception of “quantitative skills”, if the notion of “skill” includes “understanding”.  Consequently, I think that any seriously conceived teaching of the tools and skills that Hacker thinks should be part of the curriculum would actually and naturally include algebraic thinking.

Where Hacker misses the point, I think, is that just changing the topics included in the math curriculum would not solve the problem as the difficulties with fractions and proportional reasoning in early grades demonstrate. What needs change is the very conception of, and attitude towards, math and its teaching, on the part of policy makers, curriculum builders, teacher educators and teachers.  But this, as we know, involves a kind of vicious circle, since all of these people have been educated in the very same system that needs changing. Unfortunately, most recent directives from CUNY central concerning remedial mathematics reinforce that vicious circle, as “understanding” is conspicuously from the mandated Student Learning Outcomes for mathematics.

Taking into account that 70%+ of future teachers of mathematics, accordingly to AMATYC (Beyond Crossroads 2005), progress through community colleges and 75%-80% of freshmen have to take remedial mathematics, we get 50%+ of those future teachers for whom “understanding” had been eliminated from their mathematics education. Good bye fractions and proportional reasoning! That is how the vicious circle which led us to the present situation is vigorously maintained by our own university.

What is the solution? We have to cut the vicious circle, the famous Gordian knot.

How to do it?

My own predilection is mathematics teaching-research conducted by ourselves in our own classrooms aimed at improvement of learning in those very same classrooms, and beyond. Only through our objective look upon our (individual and collective) practice, standing face to face with the reality of the mathematics classroom situation yet with the desire to improve it, we creatively break the vicious circle, the Gordian knot. Because then we start learning from ourselves, not from the teachers, who of course gave us what they could. And we learn it with the help of best research tools, which give answers to the questions we need to ask to improve it. What is needed, is the critical mass of mathematics teachers and instructors, who via their classroom mathematics teaching-research can break through the boundaries of the vicious circle, re-educating themselves as well as students and thus opening the depth, the beauty and usefulness of algebra for the generations to come.

Posted in Uncategorized | 16 Comments

Mathematics and General Education

Some of our colleagues insist that all college students should be required to take a calculus class. It is a wonderful thought and not as outrageous as it may sound. My last year of high school in Poland in the 1970’s included a rigorous introduction to differential calculus (with some proofs). It was possible, because in the three previous years we had very thorough preparation in algebra, geometry and trigonometry. Elements of calculus were required on the final comprehensive exit exam for all students, regardless of their career plans. It was difficult and technical, but we understood from the way mathematics was taught that the purpose was not to learn skills that one would use later, but rather we were studying ideas, and those ideas were somewhat important. Given the level of preparation of the vast majority of students entering CUNY, teaching everyone calculus is not something we will be able to plan any time soon. If mathematics remains a component of general education (as it should), what should we teach students whose majors do not require technical applications of mathematics? In the description of the 7th edition of Peter Tannenbaum’s popular textbook Excursions in Modern Mathematics, one reads:

“Excursions in Modern Mathematics, Seventh Edition, shows readers that math is a lively, interesting, useful, and surprisingly rich subject. With a new chapter on financial math and an improved supplements package, this book helps students appreciate that math is more than just a set of classroom theories: math can enrich the life of any one who appreciates and knows how to use it.”

I have used previous editions of the book and I like it, but the publisher’s description represents all that I find objectionable in recent trends. For example, why does one need to say that the book will show that mathematics is a “useful and surprisingly rich subject.” Aren’t students supposed to know already that mathematics is useful? Why is it surprising that it is a rich subject? It is very sad, and says much about the state of pre-college education, that one has to wait for college to learn that mathematics is rich and useful. And what does it mean that “math is more than just a set of classroom theories”? It is funny, that the blurb promoting a mathematics text is so full of prejudices. One gets the impression that the publisher tells the student: Look, we know you’ve suffered all those years in school learning useless and boring “classroom theories,” but now we will show the true beauty of the subject. In the table of contents one finds a list of interesting subjects: voting schemes, fair-division games, applications of graph theory, elements of statistics, financial mathematics, Fibonacci numbers and the golden ratio, geometry of symmetries, and the mandatory fractals. All these topics are attractive and it would be hard to argue that there is anything wrong with trying to make sure that a college educated person is aware of them. At the same time, one feels that in the attempt to present the discipline through its practical applications, much of its true spirit is lost. Putting too much emphasis on the applied side of mathematics can be dangerous. First of all, how many students really get inspired by the rather mundane applications? If enriching the  life of someone who “knows mathematics” means teaching them to make decisions concerning loans or mortgages based on calculations, how is it different from just teaching them to use software that does all those calculations?

So what do we do? It is a really difficult problem and a major source of this difficulty is the enormous gap between what we expect entering students to know and what they actually know.

In the next blog I will describe a mathematics course for Liberal Arts students that I often teach and like.

Posted in Uncategorized | 5 Comments

What to blog about?

I find the new web based culture both fascinating and a bit scary. It is huge and one can get lost there easily. There is so much out there and it sometime feels like a huge party at which everyone is talking, but hardly anyone is listening. I did a short search staritng with typing “mathematics blogs” into google. The results are overwhelming. So does CUNY need a math blog of its own? Yes. We, CUNY mathematicians, need to communicate more. We have so much in common, and there are many specific problems that need to be discussed, but there does not seem to be a suitable venue for it. We do not know each other well. It may simply be the result of the particular topography of CUNY (and of our not negligible teaching loads) that there is very little room in our schedules for informal interactions. Perhaps the CUNYMath Blog can help. But what should we blog about? There is no shortage of topics. Along with the whole spectrum of issues concerning mathematics and its teaching in general, we have a host of specific CUNY issues: the Pathways initiative; the recently introduced standardized test to exit remediation; mathematics curriculum at The New Community College at CUNY; the COMPASS exam and math placement procedures. Those of you who have followed Clarion articles and related emails from the University Senate and CUNY Administrative Offices, know well that there are sharp differences of opinion. Concerning particular issues, it is easy to get lost in technical details, but it is clear that the technical details are not the cause of such strong disagreements. Rather, we tend to differ on how to react to the rapidly changing realities of college teaching and research. Here is a rather frightening description of recent trends:

http://www.nybooks.com/articles/archives/2011/jan/13/grim-threat-british-universities/

It begins with “The British universities, Oxford and Cambridge included, are under siege from a system of state control that is undermining the one thing upon which their worldwide reputation depends: the caliber of their scholarship. The theories and practices that are driving this assault are mostly American in origin, conceived in American business schools and management consulting firms. They are frequently embedded in intensive management systems that make use of information technology (IT) marketed by corporations such as IBM, Oracle, and SAP. They are then sold to clients such as the UK government and its bureaucracies, including the universities. This alliance between the public and private sector has become a threat to academic freedom in the UK, and a warning to the American academy about how its own freedoms can be threatened.”

At this level, the discussion does not involve mathematics directly, but it seems inevitable, that if the general climate in academia is changing so dramatically, no discipline will be immune, and we  should be ready for the change. What is of utmost importance is that we know what we are doing  as professionals  and why. Where should we have such a discussion? Perhaps on these pages.

Posted in Uncategorized | Comments Off on What to blog about?

Why are so many Harvard students first-borns?

The noted political philosopher Michael Sandel has taught the wildly popular course “Justice” at Harvard University for many years.  The course can be viewed online, and in Episode 8 there was an amazing moment when Professor Sandel asked his students to raise their hands if they were the first-born children in their family.  About 75 to 80 percent raised their hands.  (It’s rewarding to watching the lecture, but if you just want to locate this particular scene you can fast forward about 23 minutes.)  Professor Sandel used this data to infer that the academic effort a child exerts depends on birth order, with first born children exhibiting high effort levels, and thus being over-represented at Harvard.  But in the June 2012 issue of Significance (a bimonthly magazine published by the American Statistical Association and the Royal Statistical Society), Antony Millner and Raphael Calel pointed out that such reasoning constituted the classic cognitive illusion called base-rate neglect.  (You can read the preprint here.)  To get an idea about the base-rate effect, let’s perform a thought experiment.  Imagine that Professor Sandel is lecturing at a prestigious university in China, with a cohort of students born during the era of one-child policy.  It must look conspicuous if someone does not raise his hand, because theoretically everyone must be the first and the only child of the family!  Back to Harvard, it appears that Professor Sandel did not carefully differentiate the probability that a student is a first born given that the student is at Harvard, from the probability that a student is at Harvard given that the student is a first born.  Mathematicians use the notation \Pr(\text{1st-born} | \text{Harvard}) and \Pr(\text{Harvard} | \text{1st-born}) for the two conditional probabilities, and they are not the same.  (We know that \Pr(\text{pregnant} | \text{woman}) and \Pr(\text{woman} | \text{pregnant}) are certainly different!)  Bayes’ rule establishes a (sometime counter-intuitive) connection between the two conditional probabilities.  As explained in the technical note below, Professor Sandel’s observation that 75% to 80% of Harvard students are first-borns can be explained without recourse to any birth-order effect at all if the fertility rate of mothers with children at Harvard is 1.25 to 1.33.  It is well-known that wealthy and well-educated parents tend to have fewer children, and such a fact seems to be a more plausible explanation for the high number of first-born children at Harvard.

Bayes’ rule, in odds form, is simply O=Q \cdot R, where O denotes the posterior odds, Q denotes the prior odds, and R denotes the likelihood ratio (see the technical note below for a worked example).  As the psychologists Daniel Kahneman and the late Amos Tversky have demonstrated, there is a tendency that people (including mathematically sophisticated ones) ignore the prior odds or base rate, rather than integrate them with likelihood ratio when estimating probability.  For example, we know that people with a PhD are more likely to subscribe to The New York Times than people who ended their education after high school.  But when you see a person reading The New York Times on the subway, is he more likely to have a PhD?  Most people use PhDs as the representative of the Times readers, and ignore the fact that there are far more non-PhDs than PhDs riding in the New York subways.  Again, without carefully differentiating \Pr(\text{NYT reader} | \text{PhD}) from \Pr(\text{PhD} | \text{NYT reader}), one is prone to make a mistake.

So far, the mix-ups of \Pr(A | B) and \Pr(B | A) are rather harmless, but such a muddled thinking can lead to some serious consequences.  Many readers of this blog are probably familiar with the medical test problem.  Most people even some physicians can not give an informative estimate of the probability that a person has any disease given a positive screening test.  As a result of confusing \Pr(\text{having cancer} | \text{+ mammogram}) with \Pr(\text{+ mammogram} | \text{having cancer}), many women suffered needless anxiety about false-positive mammograms.  Because this topic has been discussed extensively, I will not say more, but refer the readers to “Mammogram Math” by Professor John Allen Paulos.  I want to mention stereotypes, which can be considered as probabilistic predictions that distinguish the stereotyped group from others.  (This was proposed by Clark McCauley and Christopher L. Stitt in 1978.)  I think most of our students have been exposed to the concept that stereotypes of race, gender, ethnicity, and religion can be harmful when they are used to discriminate or oppress.  I would like to see educators take a more quantitative approach by helping their students understand the difference between, say, \Pr(\text{terrorist} | \text{Muslim}) and \Pr( \text{Muslim} | \text{terrorist}).  While many people have the impression that many terrorist incidents involved Muslims, they often neglect the base rate—the vast majority of both Muslims and non-Muslims never commit violence.

Through these examples of \Pr(A | B) and \Pr(B | A), I hope I made a point that quantitative reasoning (QR), defined as contextualized use of numbers and data in a matter that involves critical thinking skills, should be an essential component of our general education.  Furthermore, I hope you realized that it takes not only mathematicians but also educators across various disciplines to develop students’ QR competency.  Currently, a group of CUNY faculty from several colleges, under the auspices of a NSF-funded project called NICHE, are working to infuse QR skills into their curricula; you can find more information here.

Technical Note

Bayes’ rule is often written as \Pr(A|B) = \Pr(A) \cdot \frac{\Pr(B|A)}{\Pr(B)}.  We can algebraically rearrange it into a more symmetric form, \frac{\Pr(A|B)}{\Pr(A^{c}|B)} = \frac{\Pr(A)}{\Pr(A^{c})} \cdot \frac{\Pr(B|A)}{\Pr(B|A^{c})}, or simply O = Q \cdot R as shown in the main text.  Applying this formula to Harvard students, we have \frac{\Pr(\text{1st-born}|\text{Harvard})}{\Pr(\text{not 1st-born}|\text{Harvard})} = \frac{\Pr(\text{1st-born})}{\Pr(\text{not 1st-born})} \cdot \frac{\Pr(\text{Harvard}|\text{1st-born})}{\Pr(\text{Harvard}|\text{not 1st-born})}.  The left-hand side of the equation is what Professor Sandel observed, which is the product of the base rate and the birth-order effect.  We can show that \Pr(\text{1st-born}) is the reciprocal of the fertility rate.  If we use 0.80 or 0.75 for \Pr(\text{1st-born}), which translates to a fertility rate of 1/0.80=1.25 to 1/0.75=1.33, Professor Sandel’s 75% to 80% value for \Pr(\text{1st-born}|\text{Harvard}) is entirely explained.


Posted in Uncategorized | Tagged , | 11 Comments

Statistical Pattern in Music: Predictability and Surprise

Audio engineers have known for a long time that music generated by computers sometimes sounds unnatural.  One reason for this phenomenon is the absence of small imperfections that are part of every human activity.  In a recent Physics Today article (July 2012), Holger Hennig, a postdoc at Harvard, and his collaborators described how they analyzed a professional drummer’s deviations from the metronome’s beats, and discovered correlations of the natural rhythmic imperfections.  To characterize the correlations, the researchers performed a power spectrum analysis.  The process is analogous to analyzing radio waves in the atmosphere by setting a radio to different frequencies and listening for how much power comes out at each.  The drummer’s power spectrum S(f) has the form S(f) \propto 1/f^{\alpha} with \alpha \approx 1.  (See Technical Note below for how S is related to the autocorrelation function.)  Sound sequences defined by a power spectrum are what physicists and engineers call “noise.”  (Interestingly, the composer John Cage wrote in his book Silence, “what we hear is mostly noise.  When we ignore it, it disturbs us.  When we listen to it, we find it fascinating.”)  The character of the noise changes significantly if the exponent \alpha is altered.  When \alpha is zero, the noise, called “white noise,” is entirely random as every sound is completely independent of its predecessors.  By contrast, a noise with \alpha=2 produces a far more correlated sequence of sounds which makes the noise rather predictable.
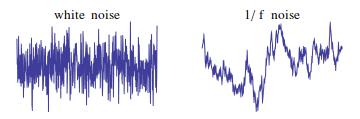
 

Hennig’s experiment and many other studies reflect the human preference for music with a balance of predictability (\alpha \approx 2) and surprise (\alpha \approx 0).  Back in the 1970s, Richard Voss and John Clarke at Berkeley found the pitch fluctuations in Bach’s First Brandenburg Concerto to obey the 1/f power law.  This year, in a paper published in the Proceedings of the National Academy of Sciences (vol 109, pp 3716-3720), Daniel Levitin, Parag Chordia and Vinod Menon reported similar pattern for the fluctuations of written note lengths in compositions of 40 different composers.  (Beethoven and Vivaldi are among the most predictable, and Mozart is among the least.)

Currently, professional audio editing software offers a humanizing feature that artificially generates rhythmic fluctuations.  However, these built-in functions are essentially random number generators producing only uncorrelated white noise.  The result is a rough ride: a rather bumpy, jerking rhythm.  The Hennig group tried to imitate the human type of imperfection by introducing rhythmic deviations that exhibit the 1/f pattern.  They prepared audio examples of a Bach’s Invention and other pieces, available at http://www.nld.ds.mpg.de/~holgerh/gallery, and found that more respondents preferred the 1/f version to its white-noise counterpart.  You can listen to these samples and make a judgment yourself.  Please share your thoughts by posting a comment.

Technical Note: For a time-fluctuating physical variable y(t) such as the drummer’s deviations from the metronome’s beats or Brandenburg Concerto’s output voltage, we can represent it as a Fourier integral y(t)=\int C(f) \cdot e^{2 \pi i f t} \, d f where the Fourier coefficient is C(f)=\int y(t) \cdot e^{2 \pi i f t} \, d t.  (The limits of all integrations in this note are \pm \infty, which we omit writing.)  The autocorrelation function \langle y(t) y(t+\tau) \rangle is a measure of how the fluctuating quantities at times t and t+\tau are related.  It can, like any other function of time, also be expressed as a Fourier integral: \langle y(t) y(t+\tau) \rangle=\int S(f) \cdot e^{2 \pi i f \tau} \, d f, where S(f) is the spectral density of y(t).  This known as the Wiener-Khintchine relations.  The spectral density is proportional to the square of the Fourier coefficient: S(f) \propto |C(f)|^{2} (recall Parseval’s Theorem).  Nowadays it is convenient to use Maple, Mathematica, Matlab, even Excel to perform a fast Fourier transform.  The above simulation of noise was produced by (inverse)-Fourier transforming the product of the power-law spectra and random numbers generated by Mathematica.  It should be quite feasible to ask students to analyze actual musical performances.  I personally am curious about the rhythmic pattern in Glenn Gould’s Bach.


Posted in Uncategorized | Tagged | 33 Comments